2001 JCO Orthodontic Practice Study, Part 2: Practice Success
In the first article in this three-part series (JCO, October 2001), we discussed trends in orthodontic economics and practice administration over the 11 biennial JCO Orthodontic Practice Studies, and we summarized the methodology of the current Study.
This month's installment will cover the factors that appear to be related to practice success in terms of net income and numbers of case starts. Most of the tables in this section use mean figures because means are required for tests of statistical significance. Elsewhere in the Practice Study, most of the tables use medians, which are less influenced by extremely high and low responses and thus may be more representative of the average practice. Throughout the Study, the annual practice data, including income and numbers of cases, refer to the calendar year preceding the survey--in other words, to the year 2000.
Net Income Level
As in our previous surveys, the Practice Study respondents were arbitrarily divided into three net income categories to allow comparisons among them: high (more than $500,000), moderate ($300,000-425,000), and low (less than $235,000). About one-quarter of the respondents fell into each category; the remaining one-quarter were omitted from these tables to help sharpen the differences among the three net income groups. It should be noted that each of these practices was owned by one orthodontist, since multiple-owner practices were excluded from the main Study results.
Similar articles from the archive:
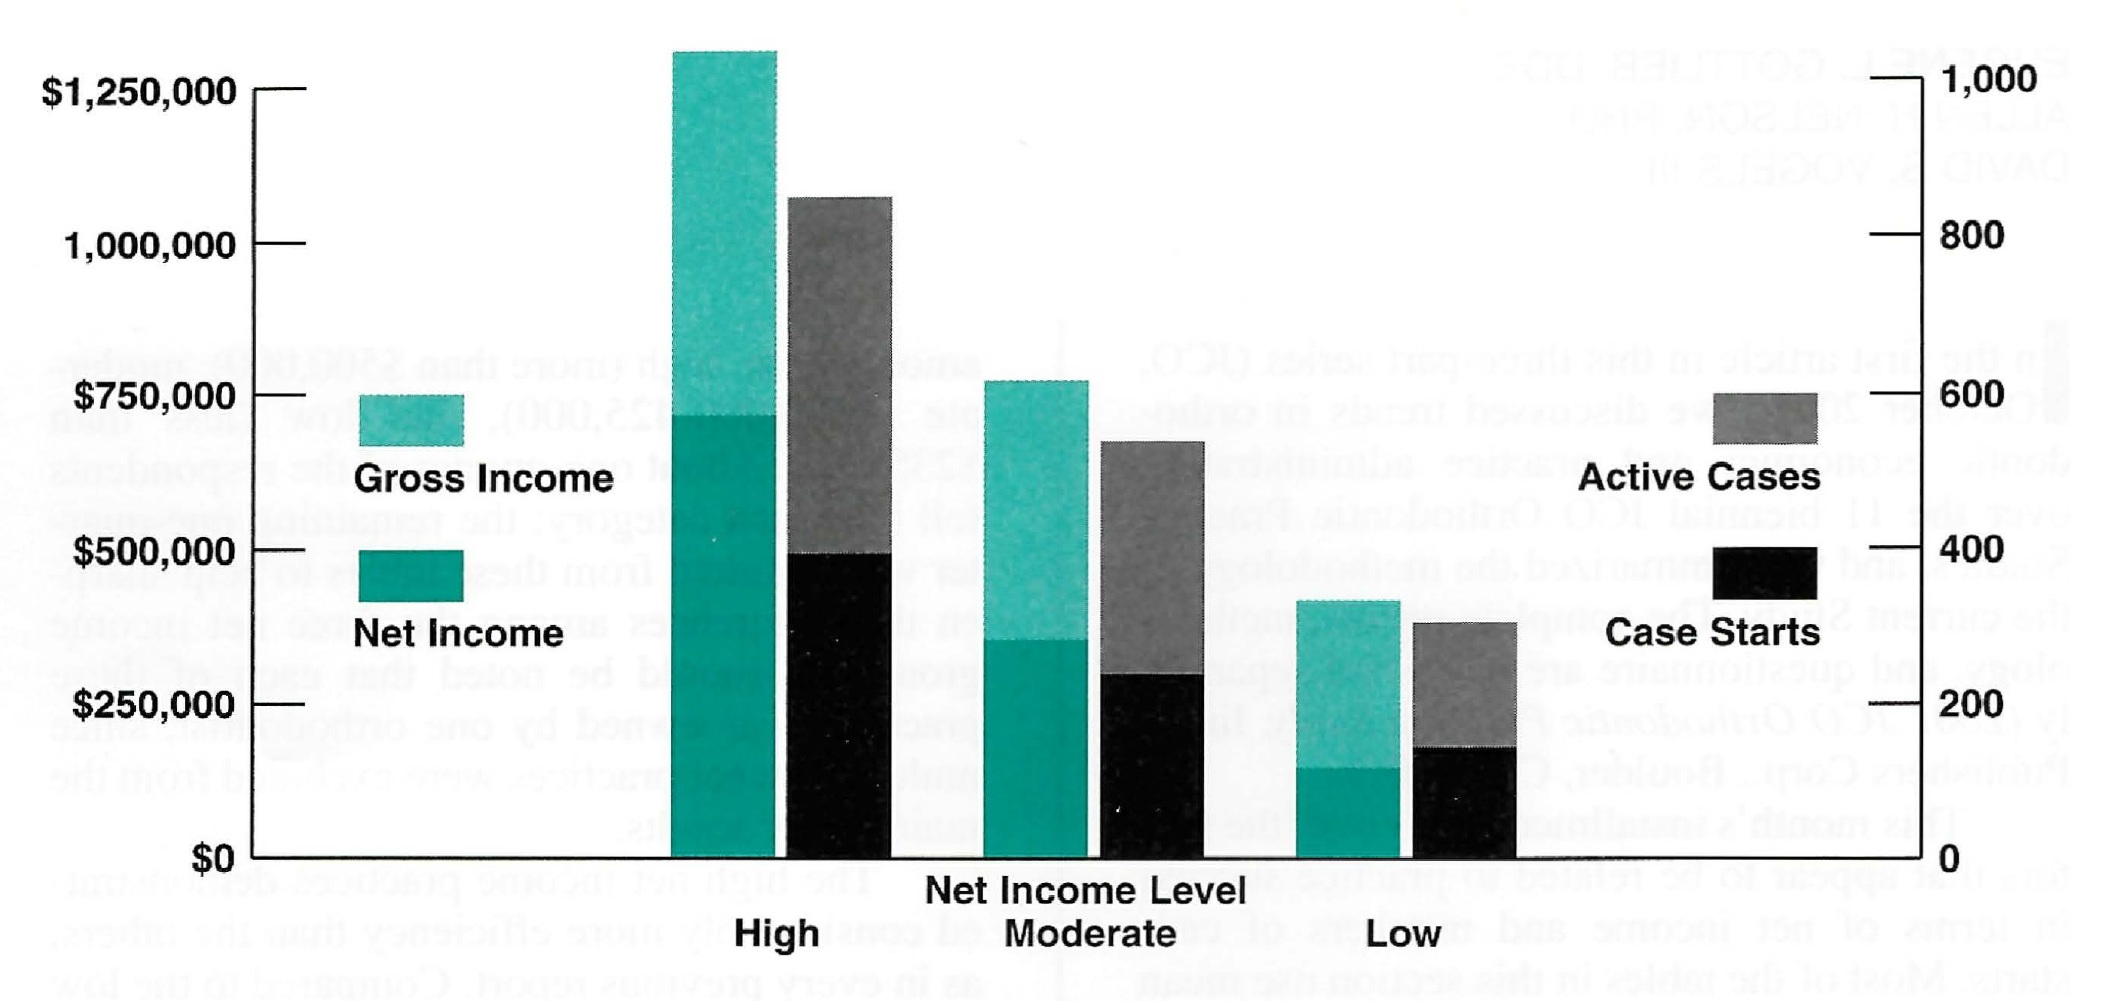
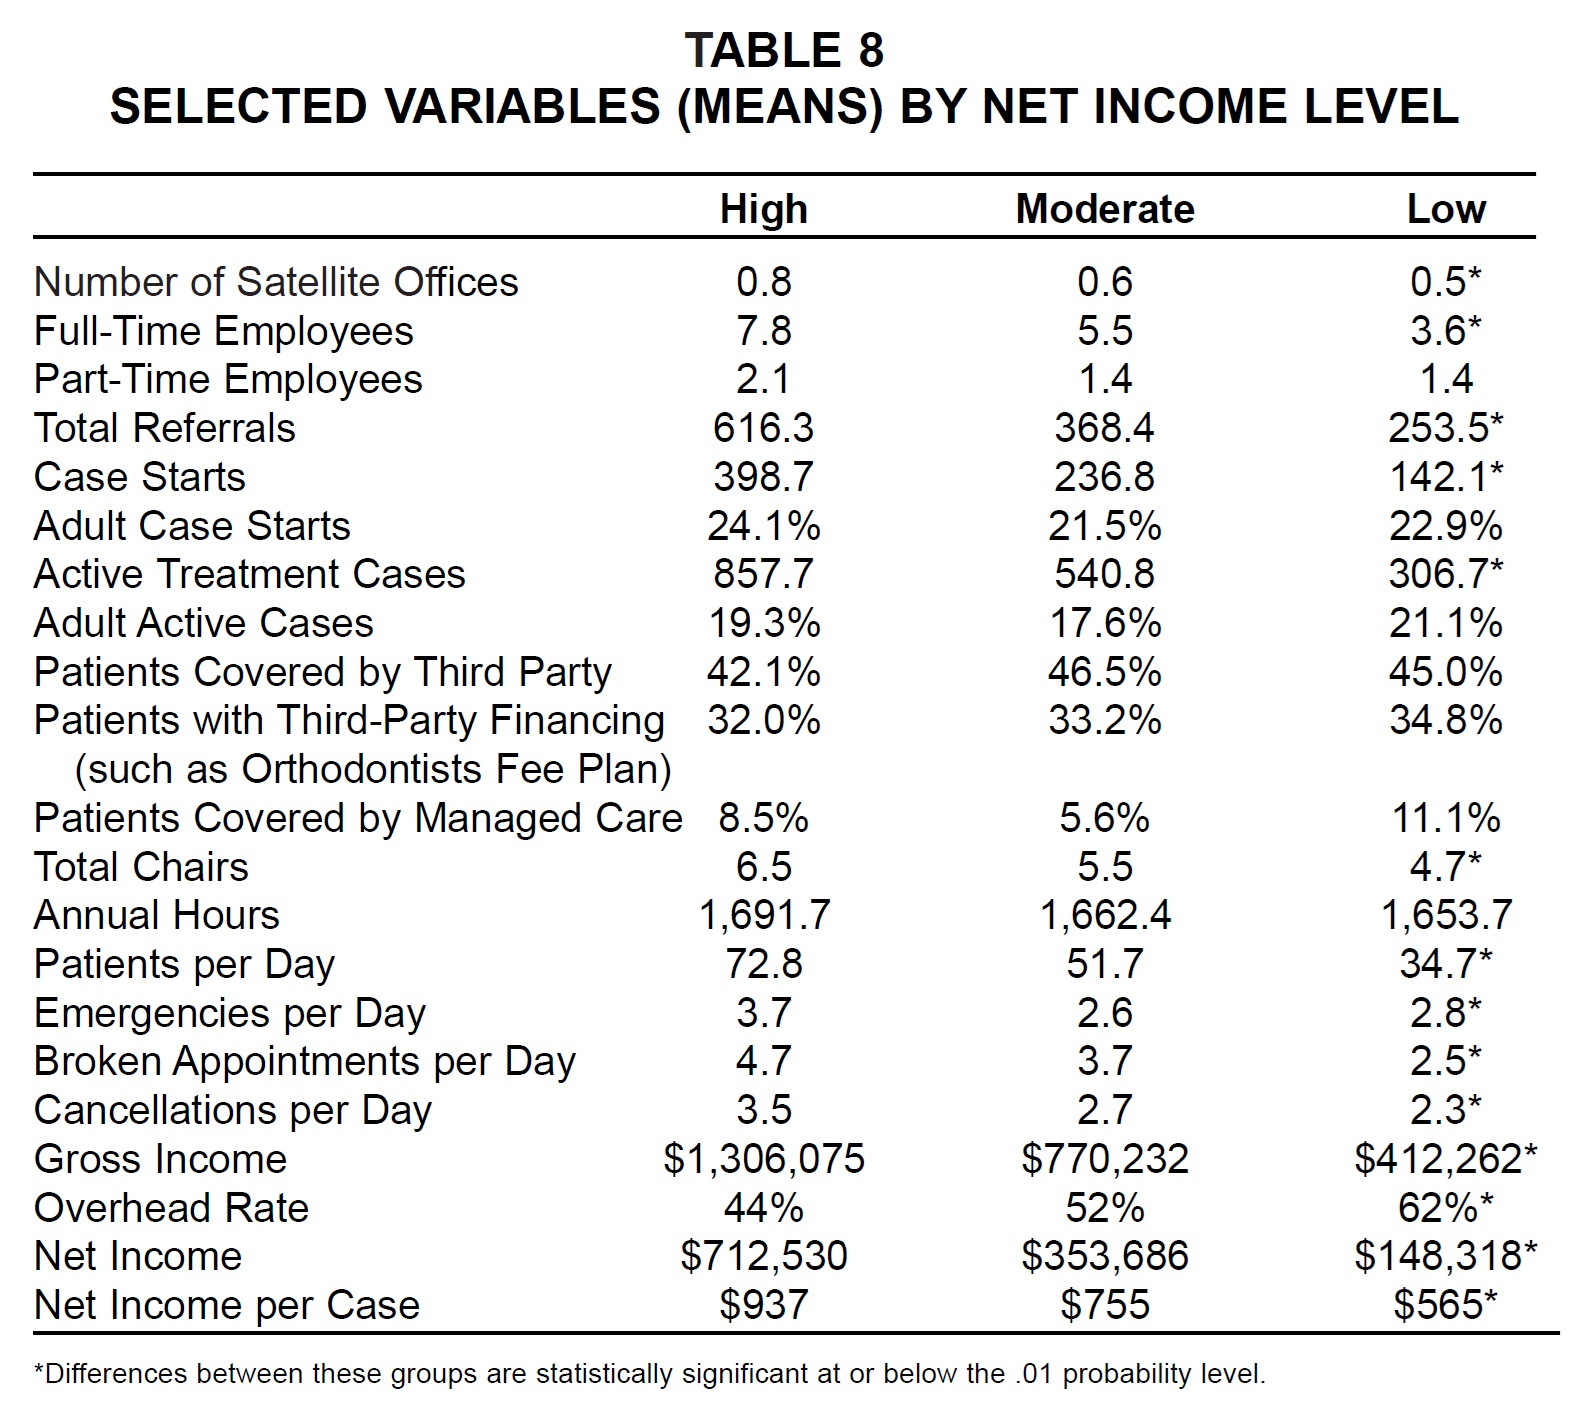
The high net income practices demonstrated considerably more efficiency than the others, as in every previous report. Compared to the low income group, the high income group reported more than three times as much gross income, nearly five times as much net income, and nearly three times as many active cases--with a significantly lower overhead rate and a significantly higher net revenue per case (Fig. 4). The high net income practices achieved these results with fewer than twice the number of total employees and only slightly more satellite offices, total chairs, and annual hours worked compared to the low net income practices. There were no significant differences among the three groups in percentages of adults, patients covered by third parties, patients with third-party financing, or managed-care patients (Table 8).
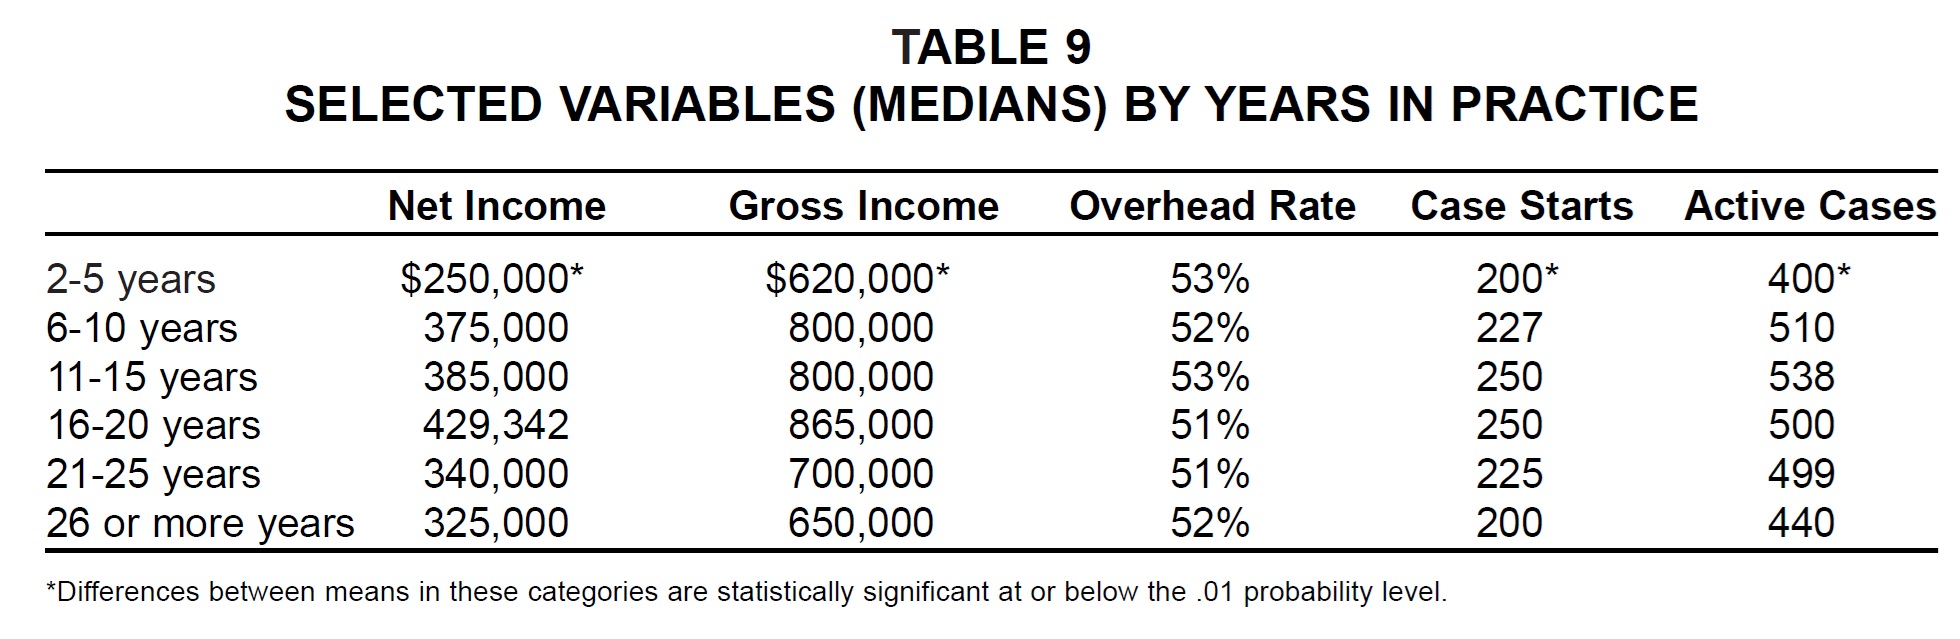
Although many of the practices in the low income group had apparently been established for less than six years or more than 20 years, there was no significant difference in overhead rate according to years in practice (Table 9). This table is the first in the JCO Studies to separate respondents who had been in practice for 21-25 years from those in practice for more than 25 years. It continues to show a decline in revenue and case starts after 20 years in practice, although the dropoff in active cases seems to occur later.
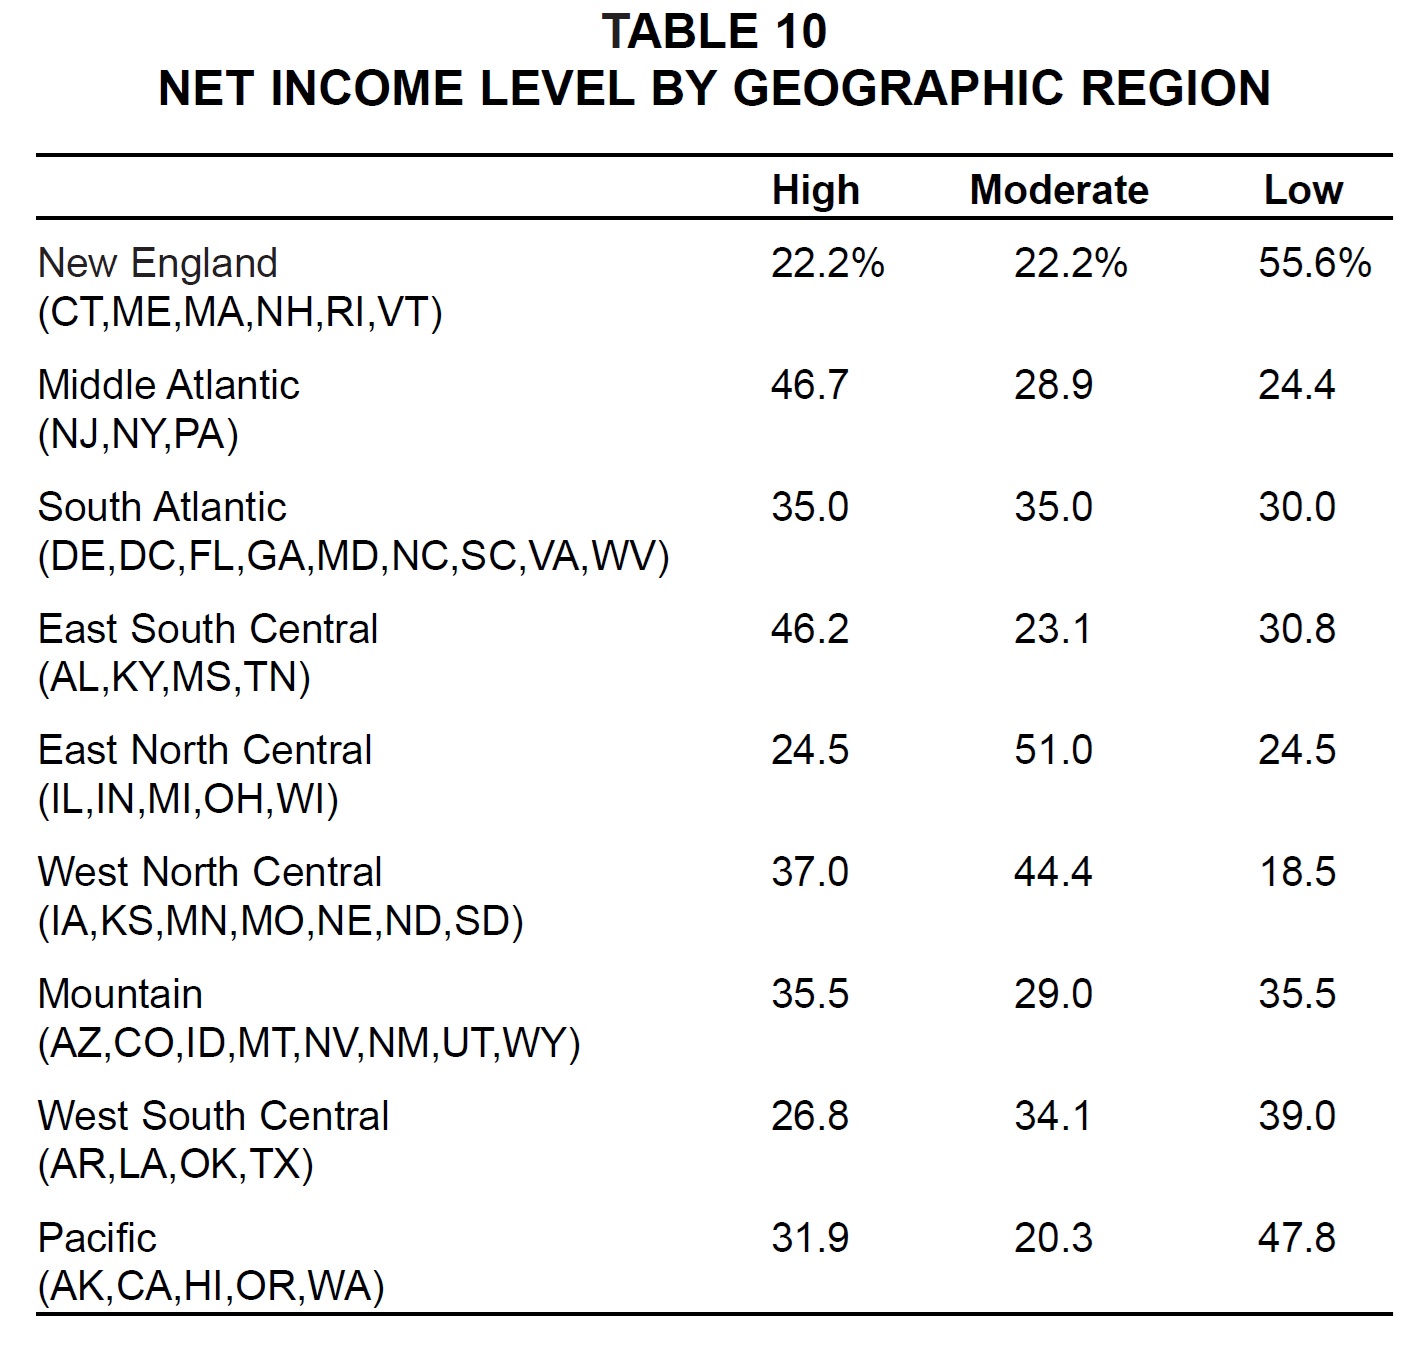
When respondents in the three net income categories were divided geographically, the Middle Atlantic and East South Central regions had the highest percentages of respondents in the high net income group (Table 10). The West North Central region showed the lowest percentage of low net income respondents, and the New England and Pacific regions reported the highest percentages of low net income respondents.
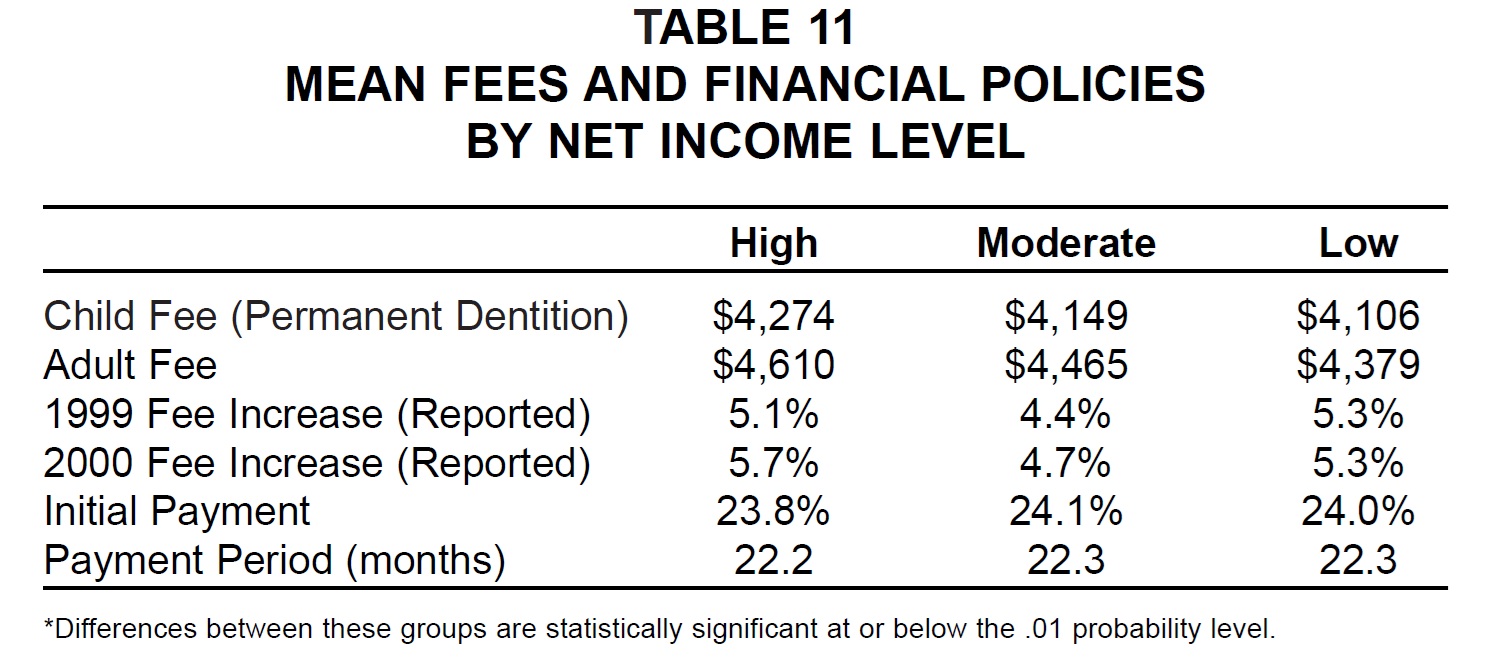
There was no significant difference in fees or financial policies among the net income groups, although high net income practices charged somewhat higher fees than the other practices did (Table 11).
Management Methods
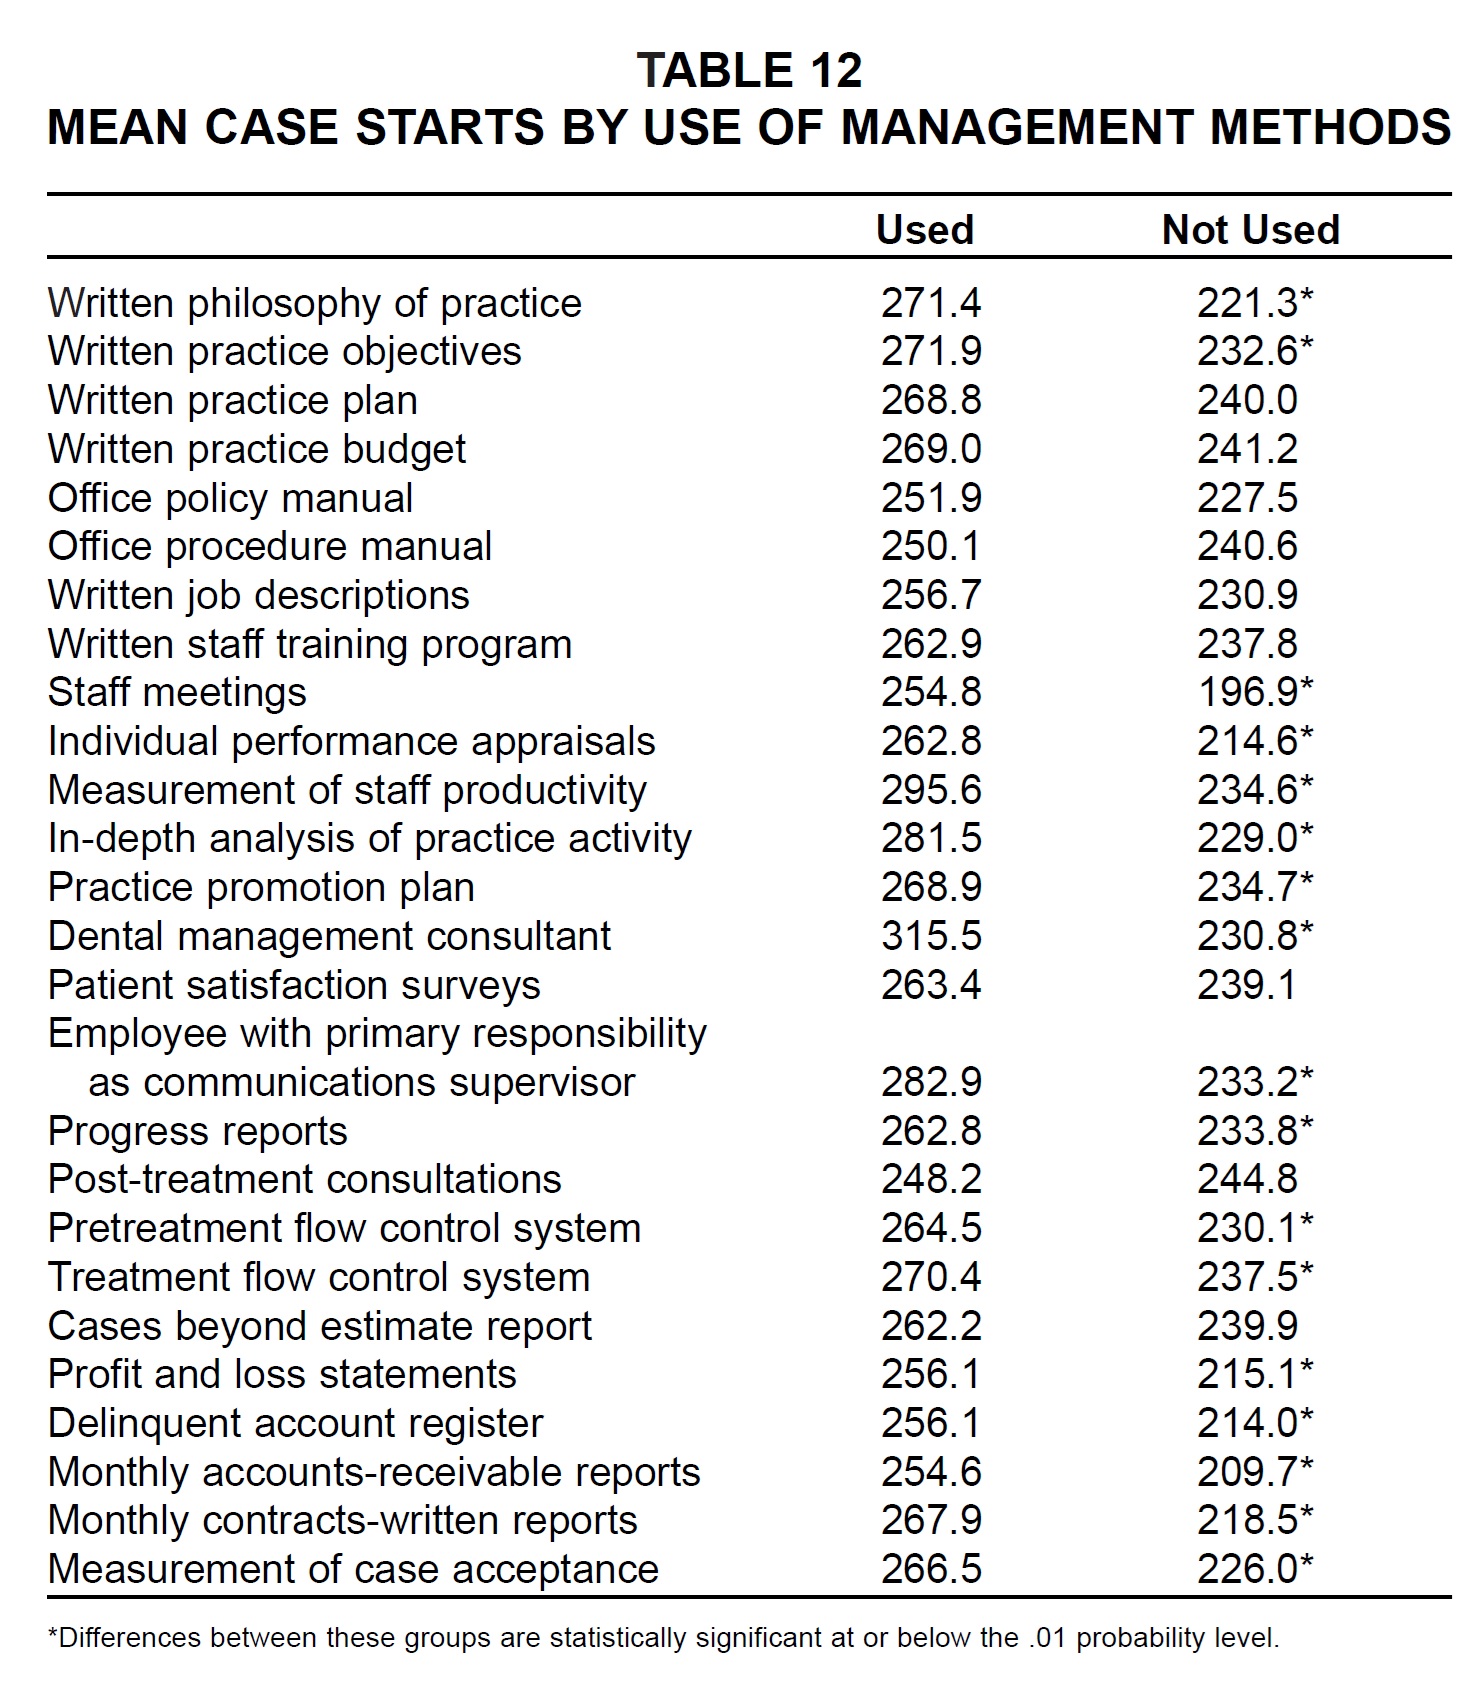
Every management method listed on the questionnaire was associated with greater mean numbers of case starts for users than for nonusers (Table 12). The differences in case starts were statistically significant for 17 of the 26 methods--the same number as in the 1999 Practice Study.
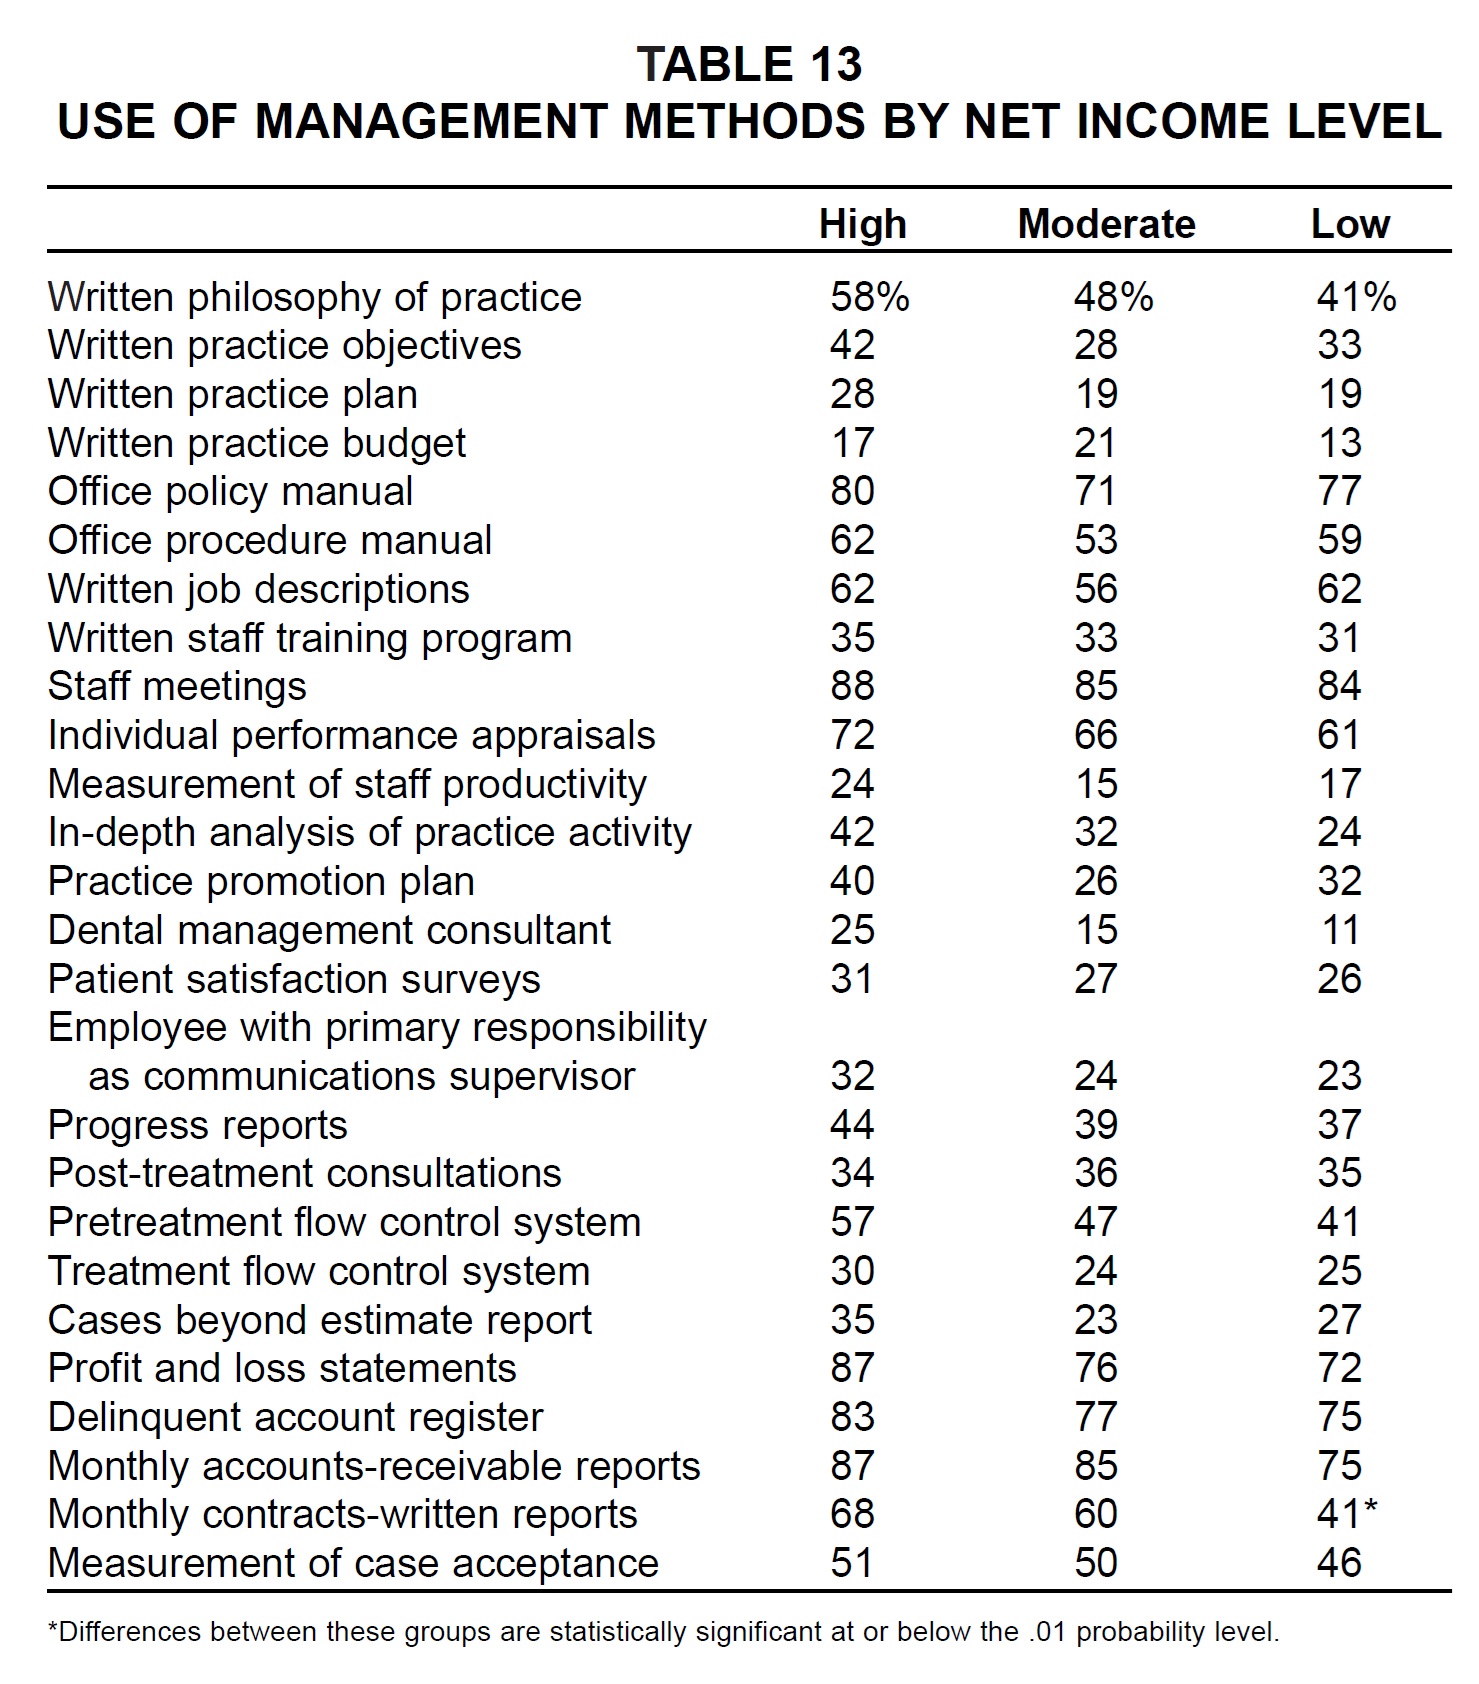
The high net income practices were more likely to use each method than the low net income practices were, except for written job descriptions and post-treatment consultations (Table 13). Only monthly contracts-written reports, however, showed a significant difference in usage among the three income categories.
Delegation
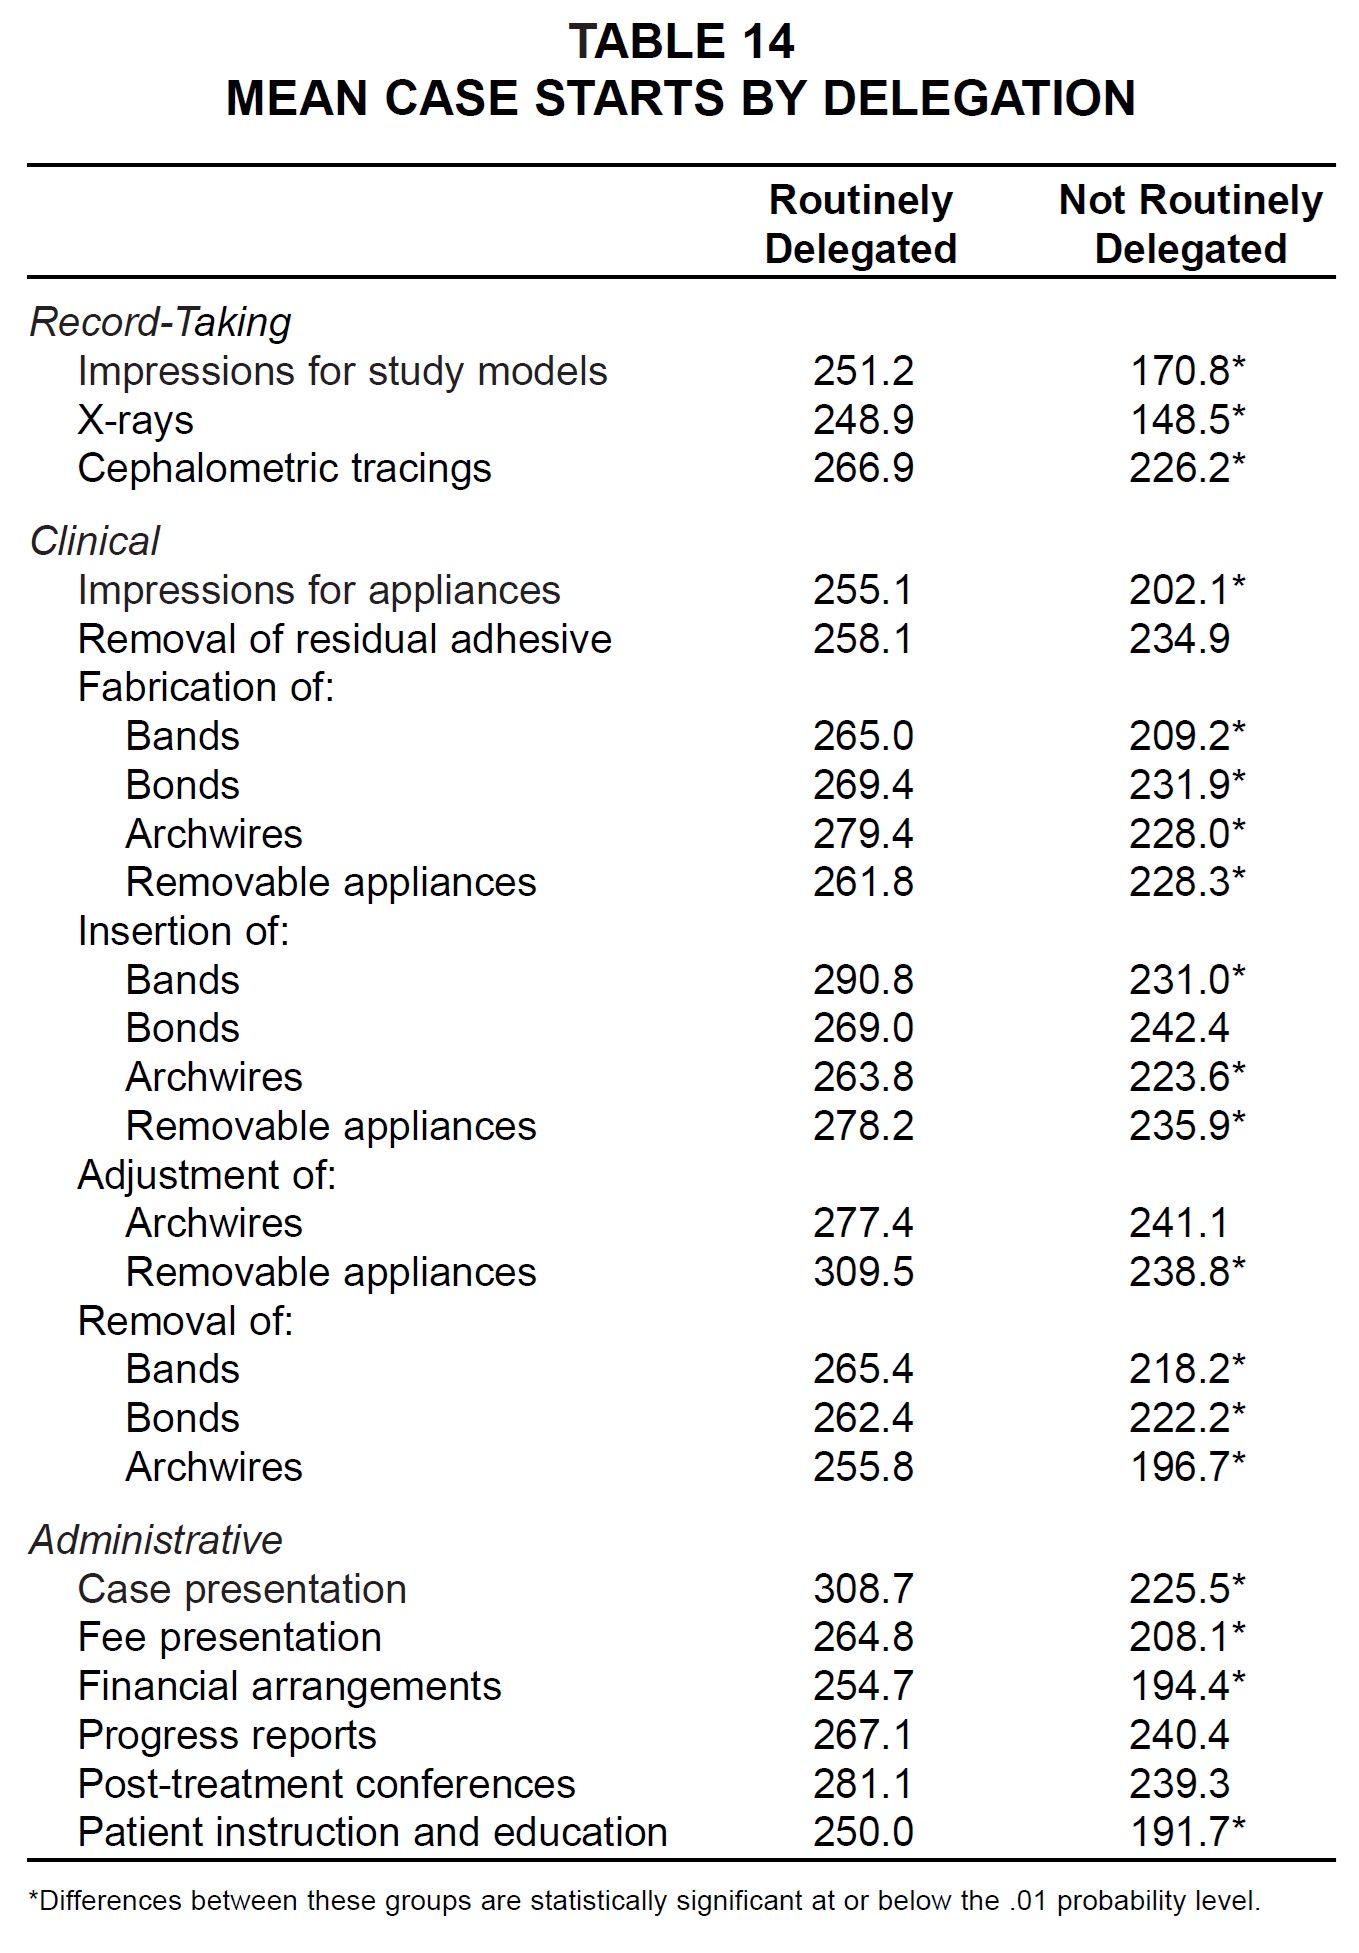
Routine delegation of every task surveyed, as opposed to delegating occasionally or not at all, was also associated with greater mean numbers of case starts (Table 14). The differences in case starts were statistically significant for every task except removal of residual adhesive, insertion of bonds, adjustment of archwires, progress reports, and post-treatment conferences.
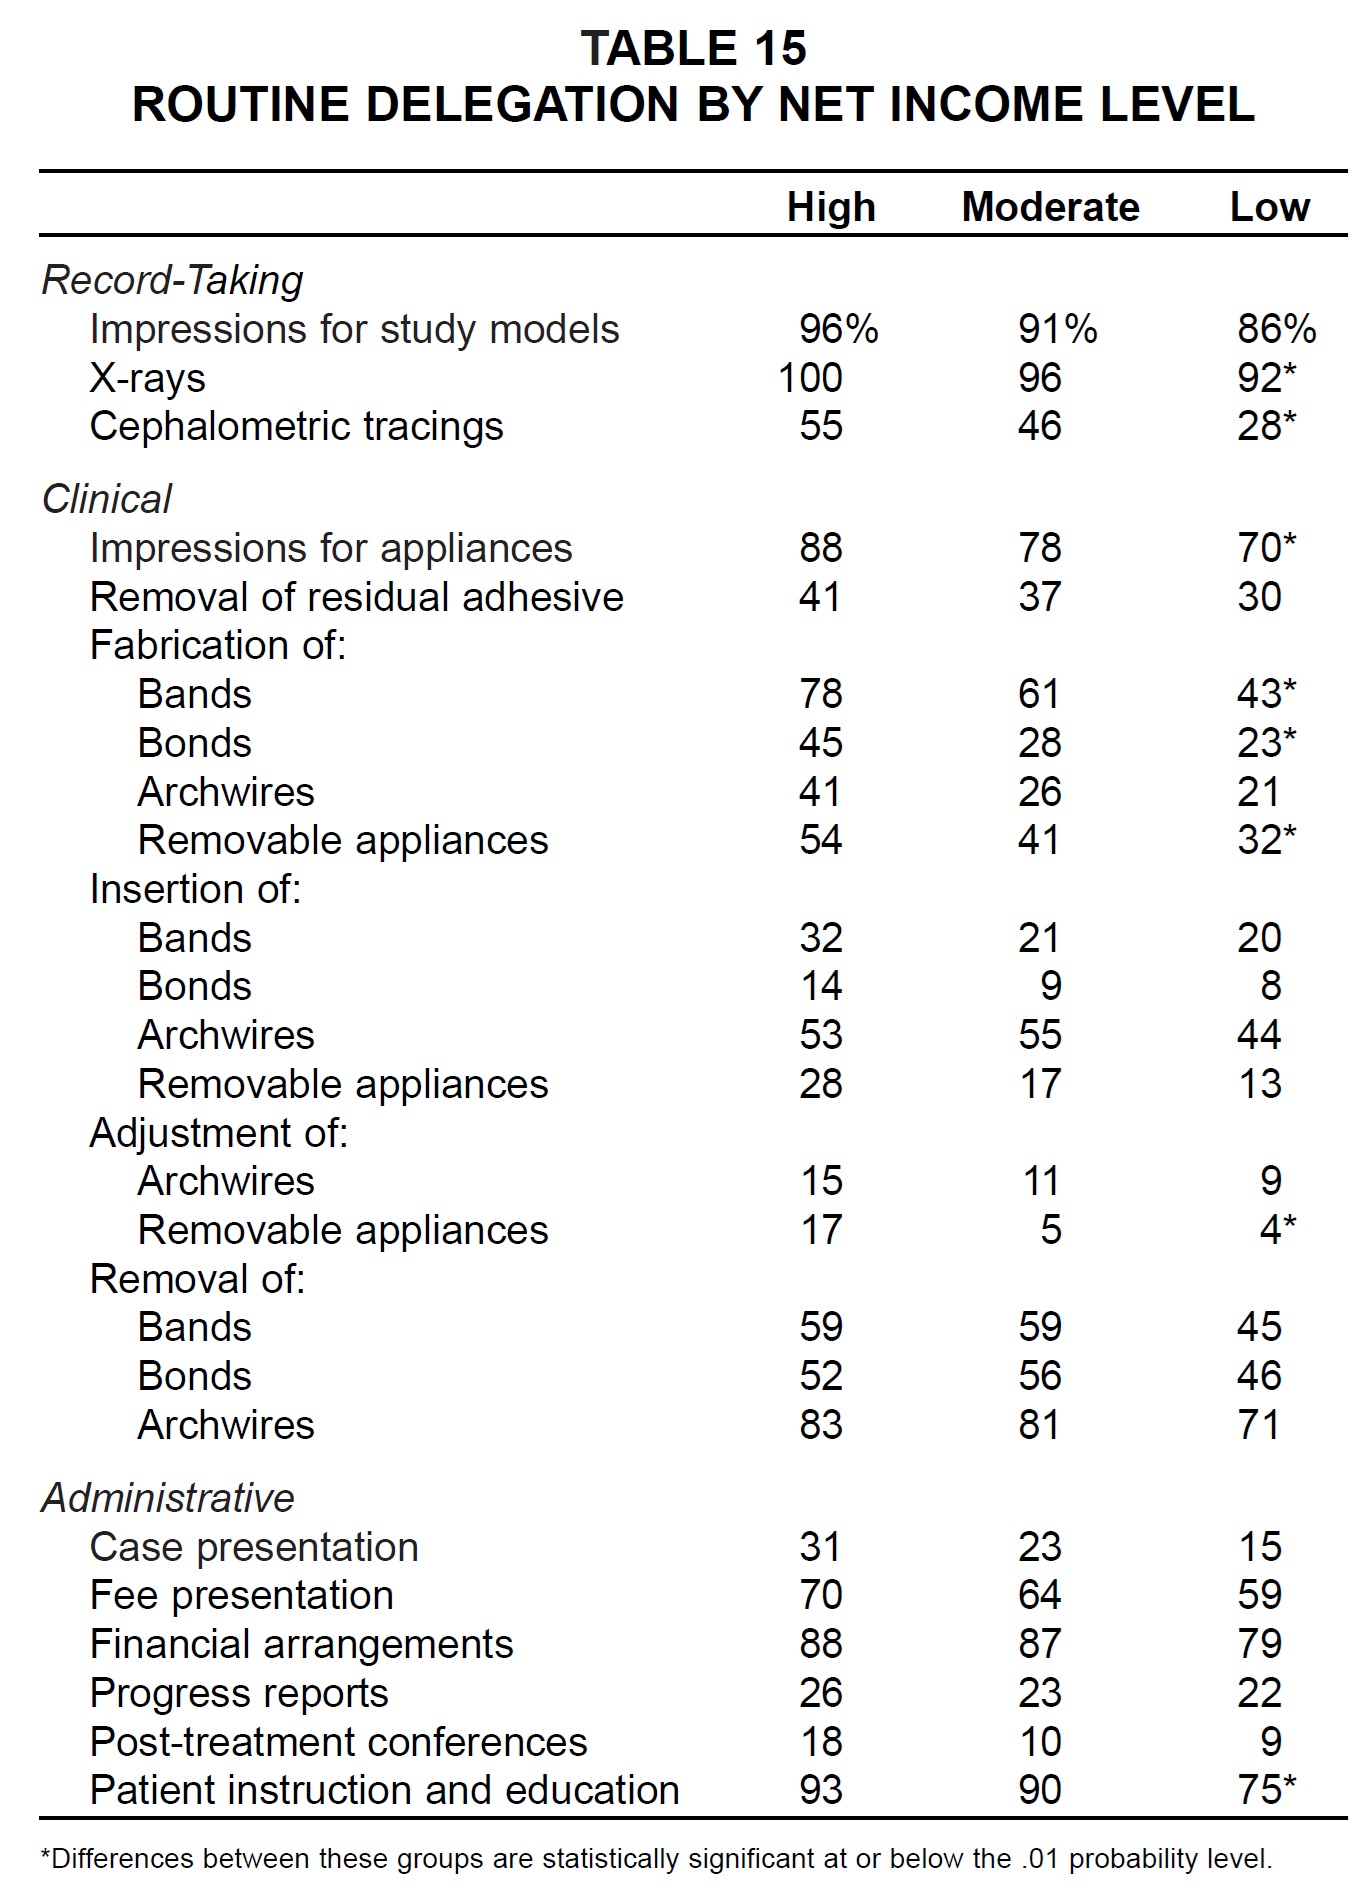
The respondents in the high net income category delegated each task more routinely than the practices in the low net income category did (Table 15). The differences in delegation among the three net income groups were statistically significant for x-rays; cephalometric tracings; impressions for appliances; fabrication of bands, bonds, and removable appliances; adjustment of removable appliances; and patient instruction and education.
Practice-Building Methods
There were no significant differences in either usage or effectiveness ratings of practice-building methods among the three net income groups, as in the past two studies (Table 16). The most popular methods among the high net income practices (used by two-thirds or more) were: treat adult patients, on time for appointments, on-time case finishing, no-charge initial visit, letters of appreciation to general dentists, letters of appreciation to patients and parents, and follow-up calls after difficult appointments.
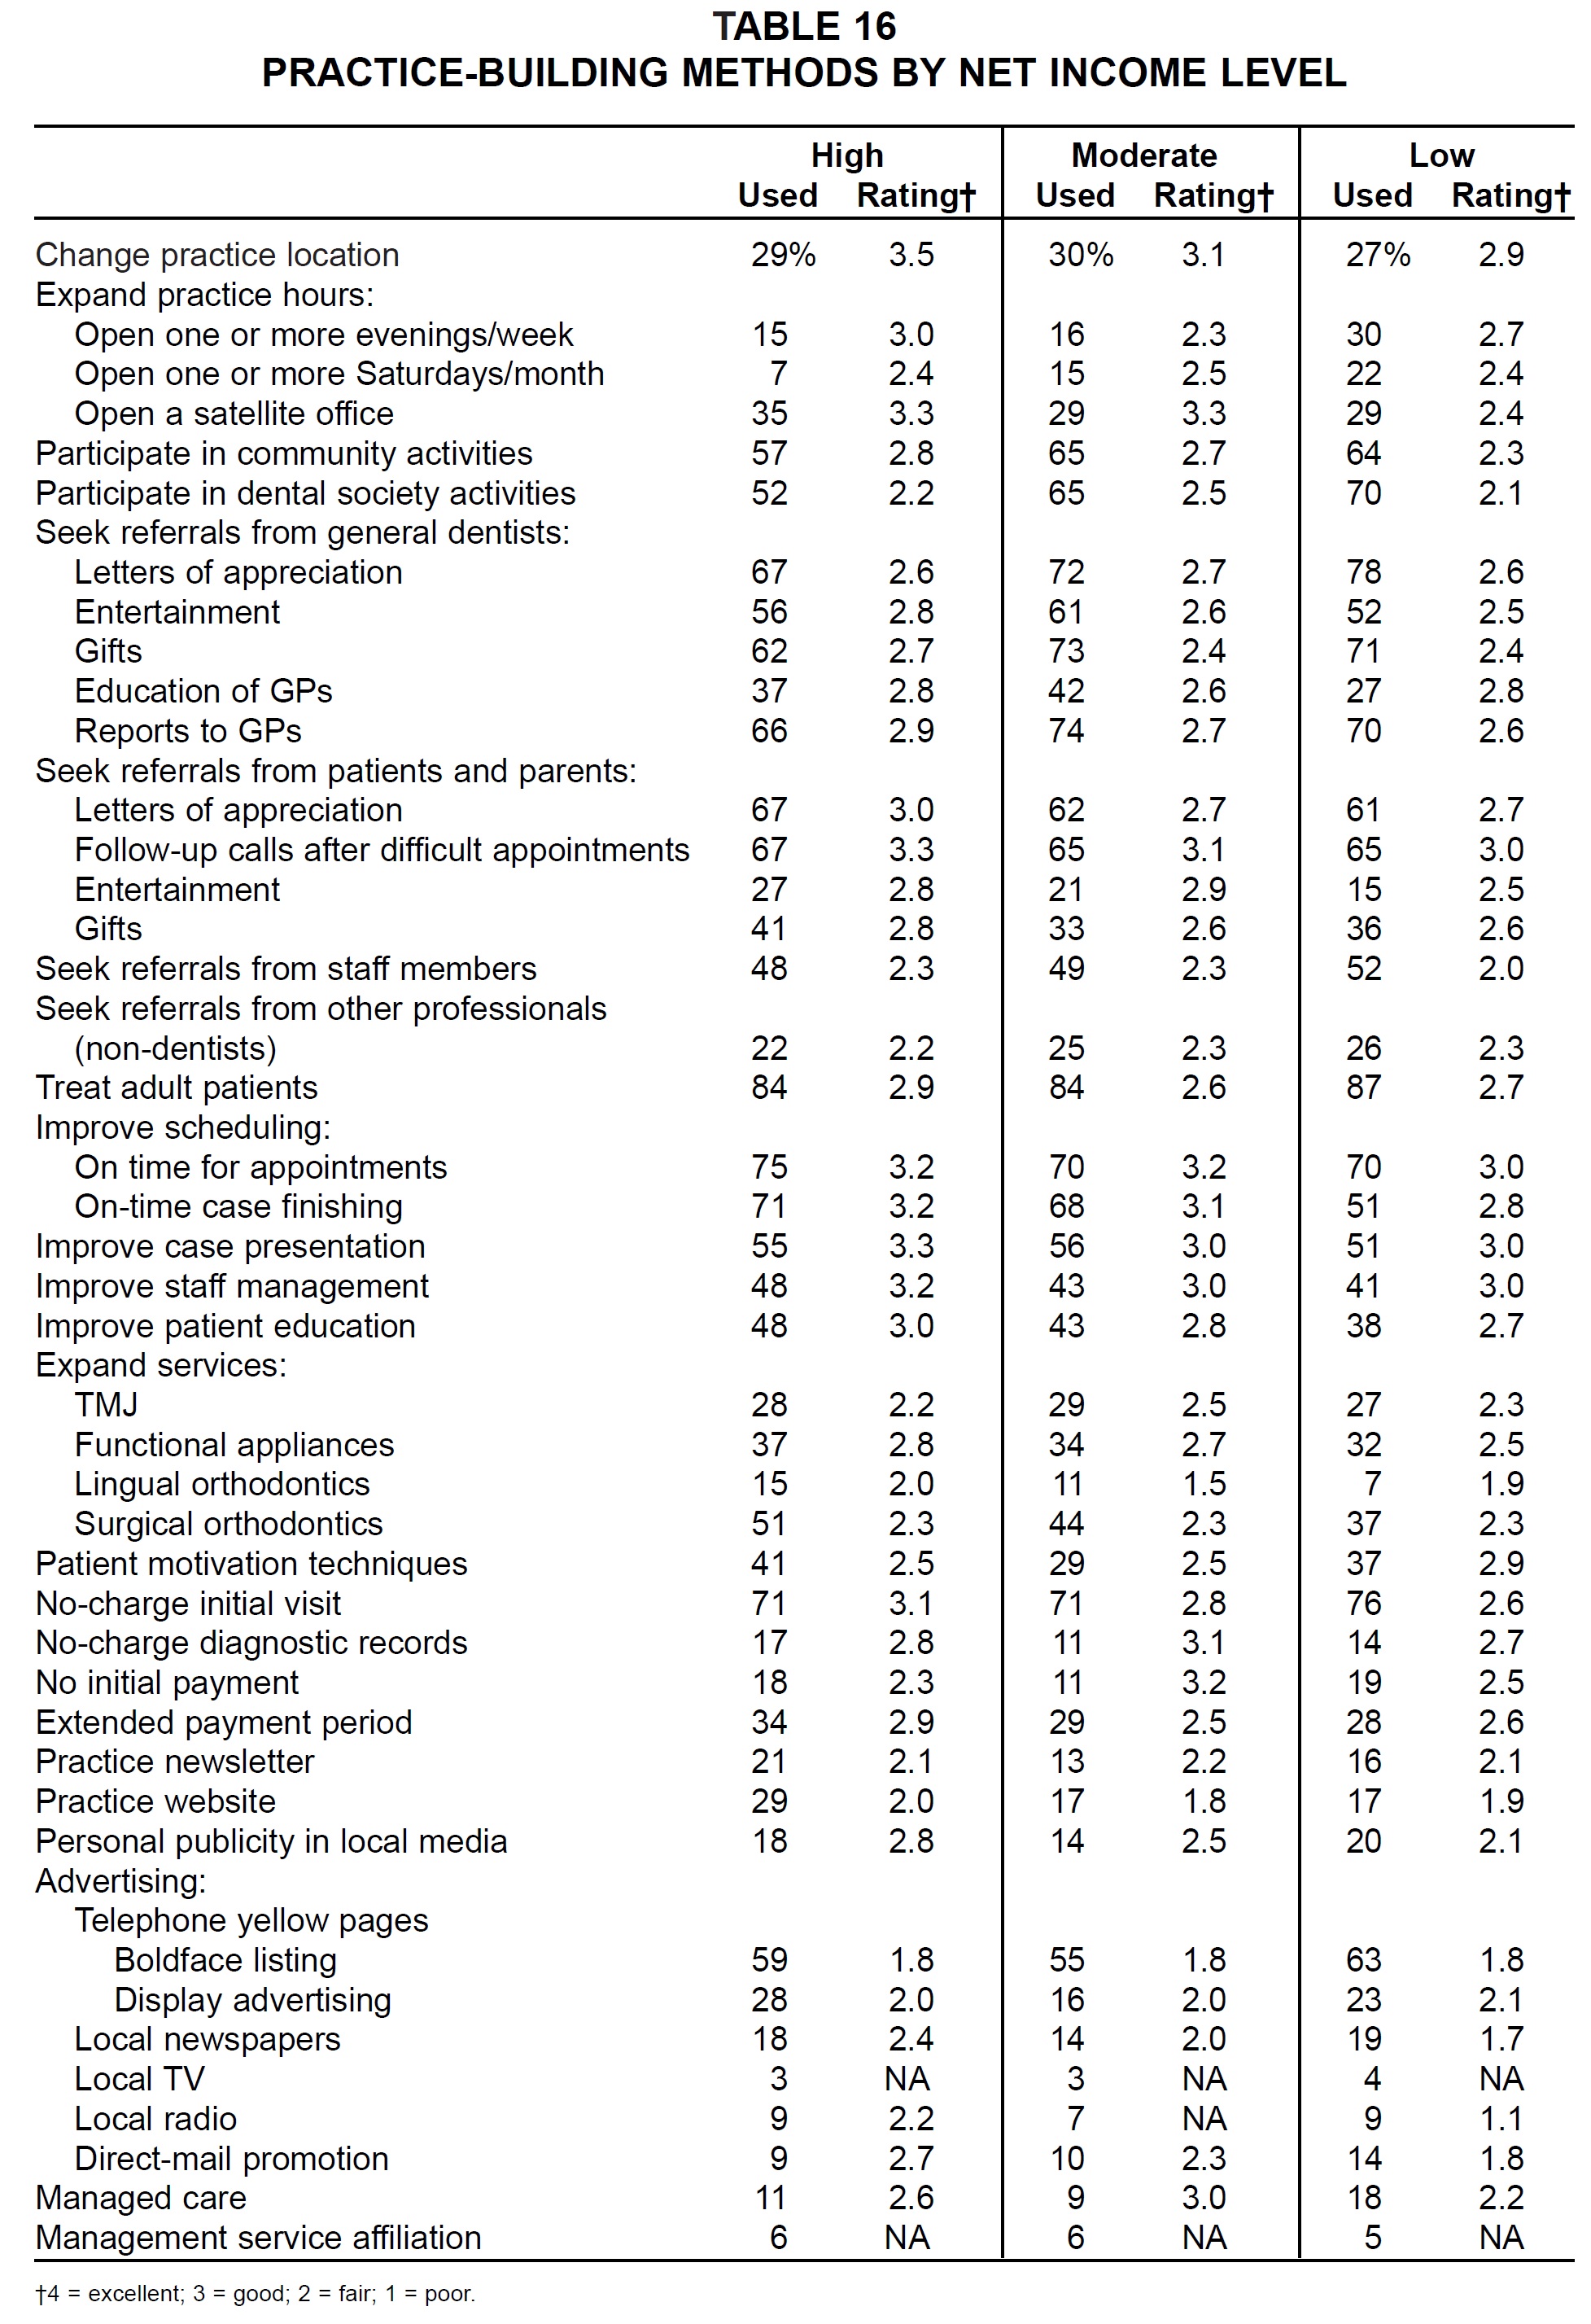
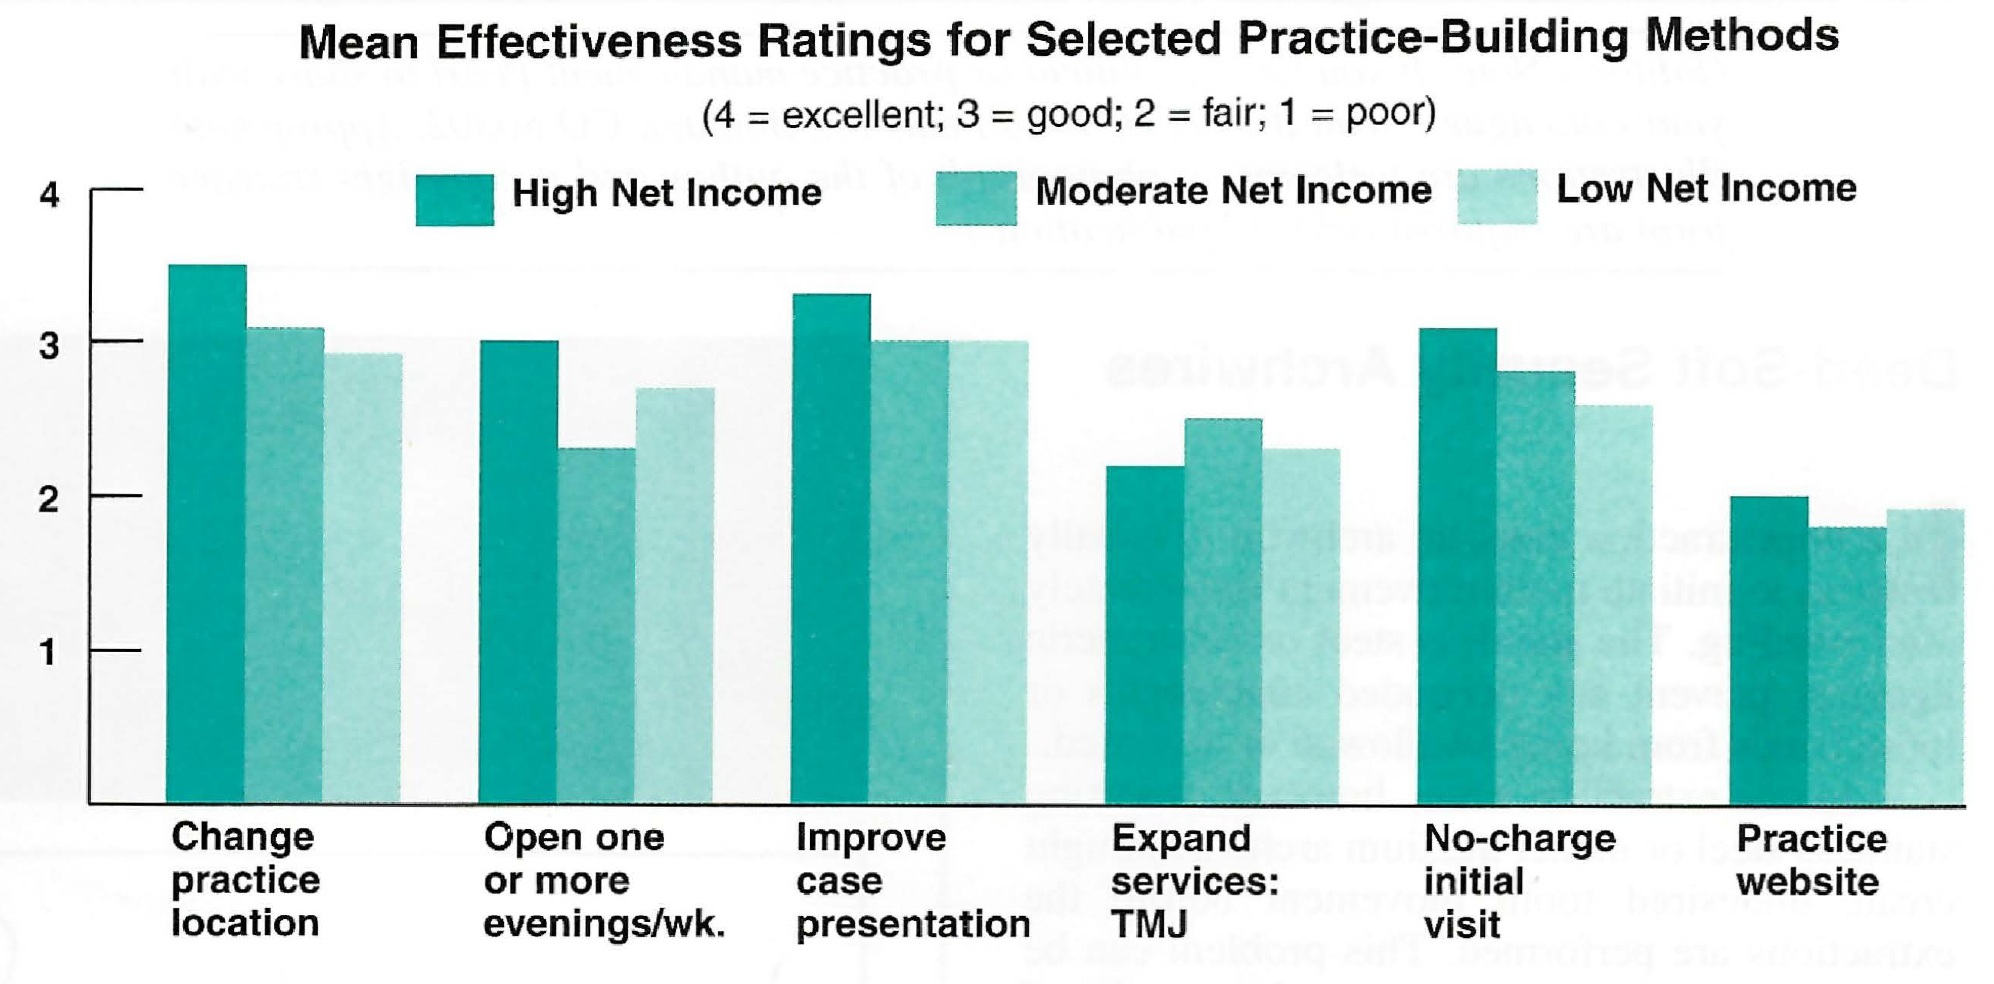
The most successful practice-building methods might be those rated good (3.0) or better by the high net income practices that used them. These were: change practice location, open a satellite office, follow-up calls after difficult appointments, improve case presentation, on-time for appointments, on-time case finishing, improve staff management, no-charge initial visit, open one or more evenings per week, letters of appreciation to patients and parents, and improve patient education. Conversely, the methods rated fair (2.0) or worse by the low net income users were: radio advertising, newspaper advertising, yellow pages boldface listing, direct-mail promotion, lingual orthodontics, practice website, and seek referrals from staff members (Fig. 5).
-
 DR. GOTTLIEB
 -
 DR. NELSON
 -
 MR. VOGELS
Dr. Gottlieb is Senior Editor and Mr. Vogels is Managing Editor of the Journal of Clinical Orthodontics, 1828 Pearl St., Boulder, CO 80302. Dr. Nelson is Director and Research Consultant, Nelson Associates, Nederland, CO.