2001 JCO Orthodontic Practice Study, Part 1: Trends
This three-part series will report the key results of the latest JCO Orthodontic Practice Study, which has been conducted every two years since 1981. The first article examines trends in orthodontic economics and practice administration over the past 20 years. In the following two issues, we will discuss factors that seem to be related to practice success and practice growth. The complete Practice Study results, methodology, and questionnaire are published separately.
Methodology
The 2001 JCO Orthodontic Practice Study questionnaire was mailed on April 23, 2001, to 9,058 orthodontists--virtually all the practicing specialists in the United States. As a reminder, a second questionnaire was mailed to the same group on May 21, 2001. A total of 814 orthodontists returned their survey forms, making a response rate of 9%.
An independent company entered the individual responses on computer. Data analysis was conducted using the Statistical Package for the Social Sciences. Several overall exclusions were made, as had been done in previous reports. To ensure that the Study represented only single-owner, full-time orthodontic practices, respondents with multiple owners or with gross incomes of less than $60,000 and fewer than 50 case starts in 2000 were eliminated from the analysis. In addition, any questionnaires that were illegible or obviously invalid were also excluded. This left 683 questionnaires for the final tabulations.
Most of the tables in these articles report the median, which is the middle number when all responses are arranged in order from highest to lowest, instead of the mean, which is the arithmetic average. This is because the median is considered less likely to be influenced by extremely high or low responses. Means must be used, however, for any tests of statistical significance.
Any annual totals, such as numbers of cases and income figures, refer to the preceding calendar year--in this Study, calendar year 2000. For purposes of space and clarity, the tables on trends omit data from 1983, 1987, 1991, 1995, and 1997. Those figures were published in the respective years, but generally reflect the same trends shown in the tables.
Similar articles from the archive:
- 1999 JCO Orthodontic Practice Study, Part 1: Trends October 1999
- 1997 JCO Orthodontic Practice Study, Part 1: Trends October 1997
- 1995 JCO Orthodontic Practice Study, Part 1: Trends October 1995
Limitations
Potential limits to the accuracy of this Practice Study include the frequency of and the possibility that answers were not given accurately. The geographic distribution of the respondents and the consistency of the data over the past 20 years tend to confirm the validity of the data. Although the accuracy of individual responses could not be independently verified, any answers that were illegible or were clearly impossible were excluded from the appropriate tables.
We will attempt to draw reasonable conclusions from the data presented in this series, but we must point out that a statistical relationship does not prove a causal relationship. If practices that use a particular management method have more net income than respondents who didn't use the method, this does not necessarily indicate that the management method caused the increased income. Many other factors may have been involved in the success of those practices.
Practice Activity
The orthodontic boom that began around 1990 continued virtually unabated, with signs of economic slowdown visible only in respondents' current and predicted growth trends (see Part 3, JCO, December 2001). The median number of case starts increased for the fifth consecutive Study, but by only 9%, compared to 11% between 1996 and 1998 (Table 1). The percentages of adult patients and case starts rose for the first time since the 1987 Study.
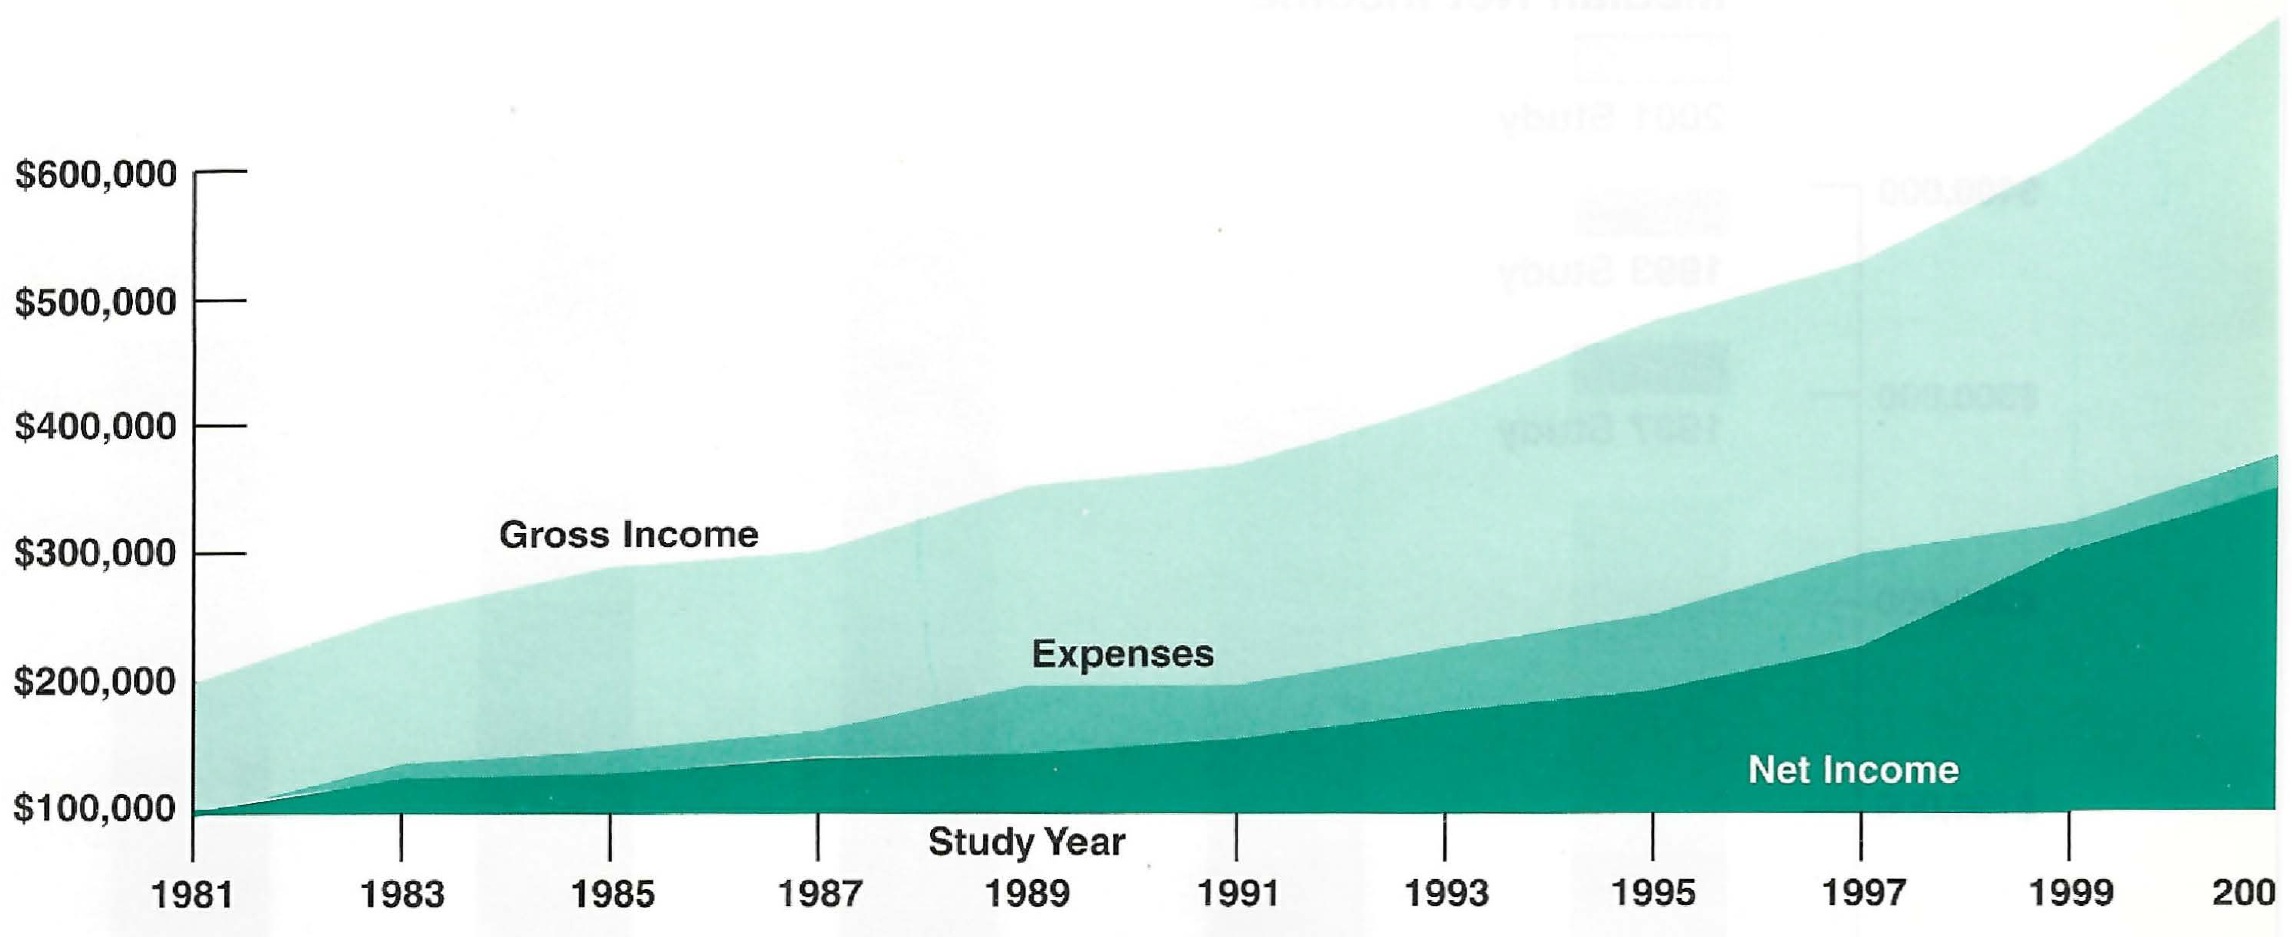
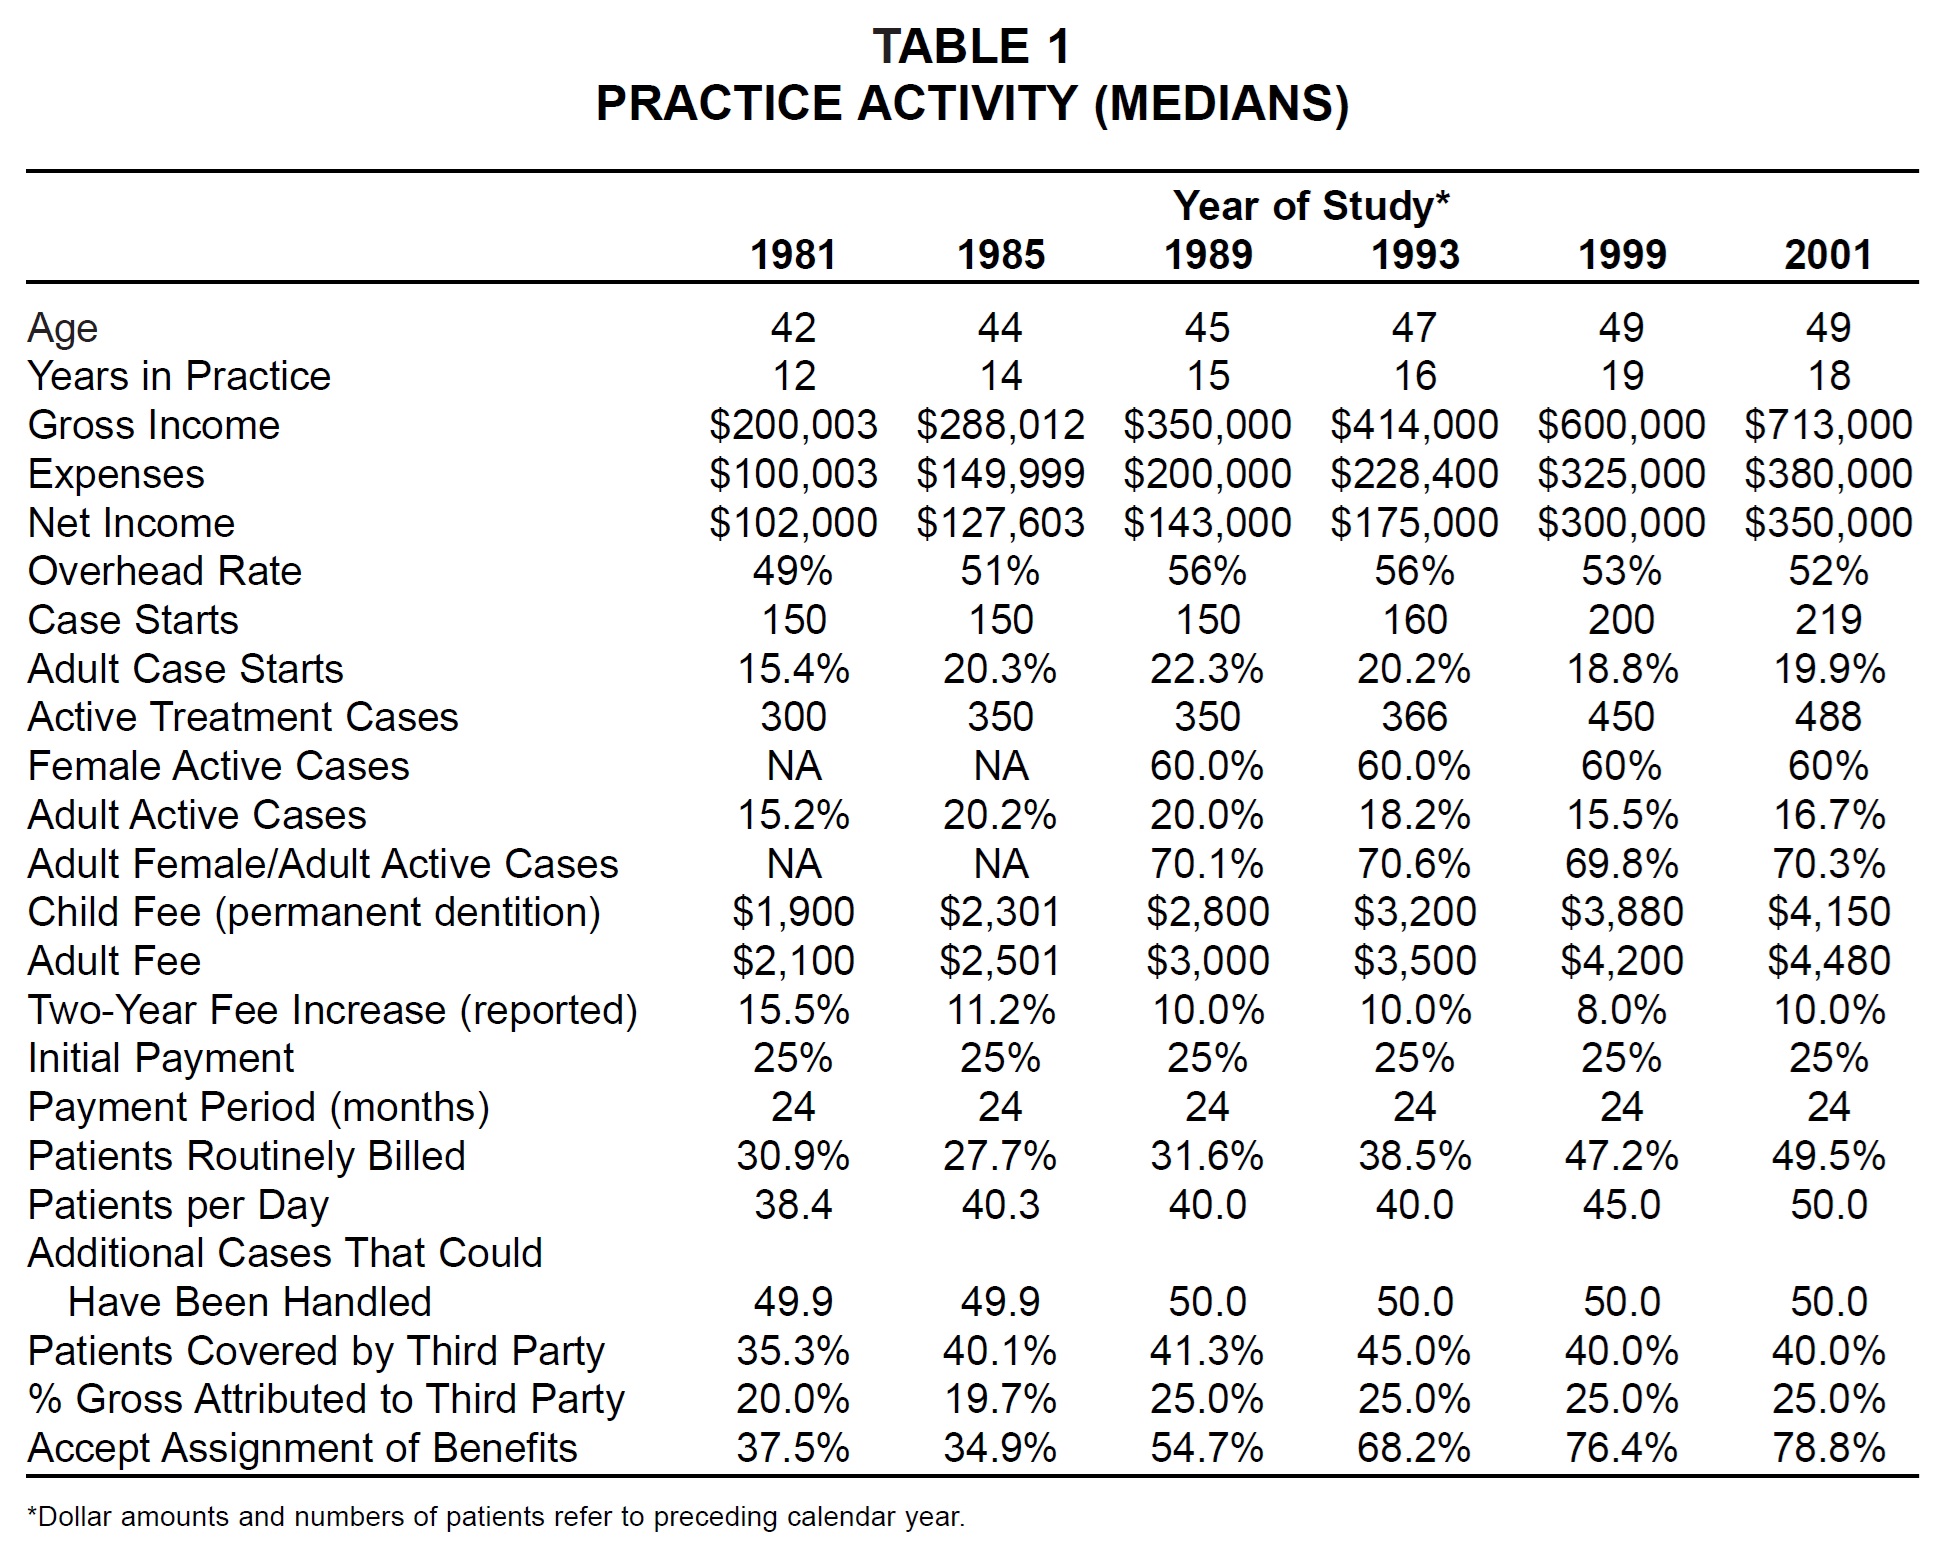
Median gross income increased by nearly 19% since 1998. Both median expenses and median net income rose by about 17%, and the median overhead rate declined for the second consecutive Study (Fig. 1).
The reported fee increase of 10% between 1998 and 2000 was higher than the 8% of the past two studies, but the actual two-year increase in median fees, about 7%, was about the same as in previous reports. With inflation remaining moderate, it appears orthodontists are continuing to raise their fees 4-5% per year.
Acceptance of assignment of benefits and routine billing of patients continued a gradual increase evidenced over the past 20 years. In an additional question not surveyed previously, two-thirds of the respondents said they used third-party financing such as Orthodontists Fee Plan. Other financial policies were about the same as in past studies.
Years in Practice
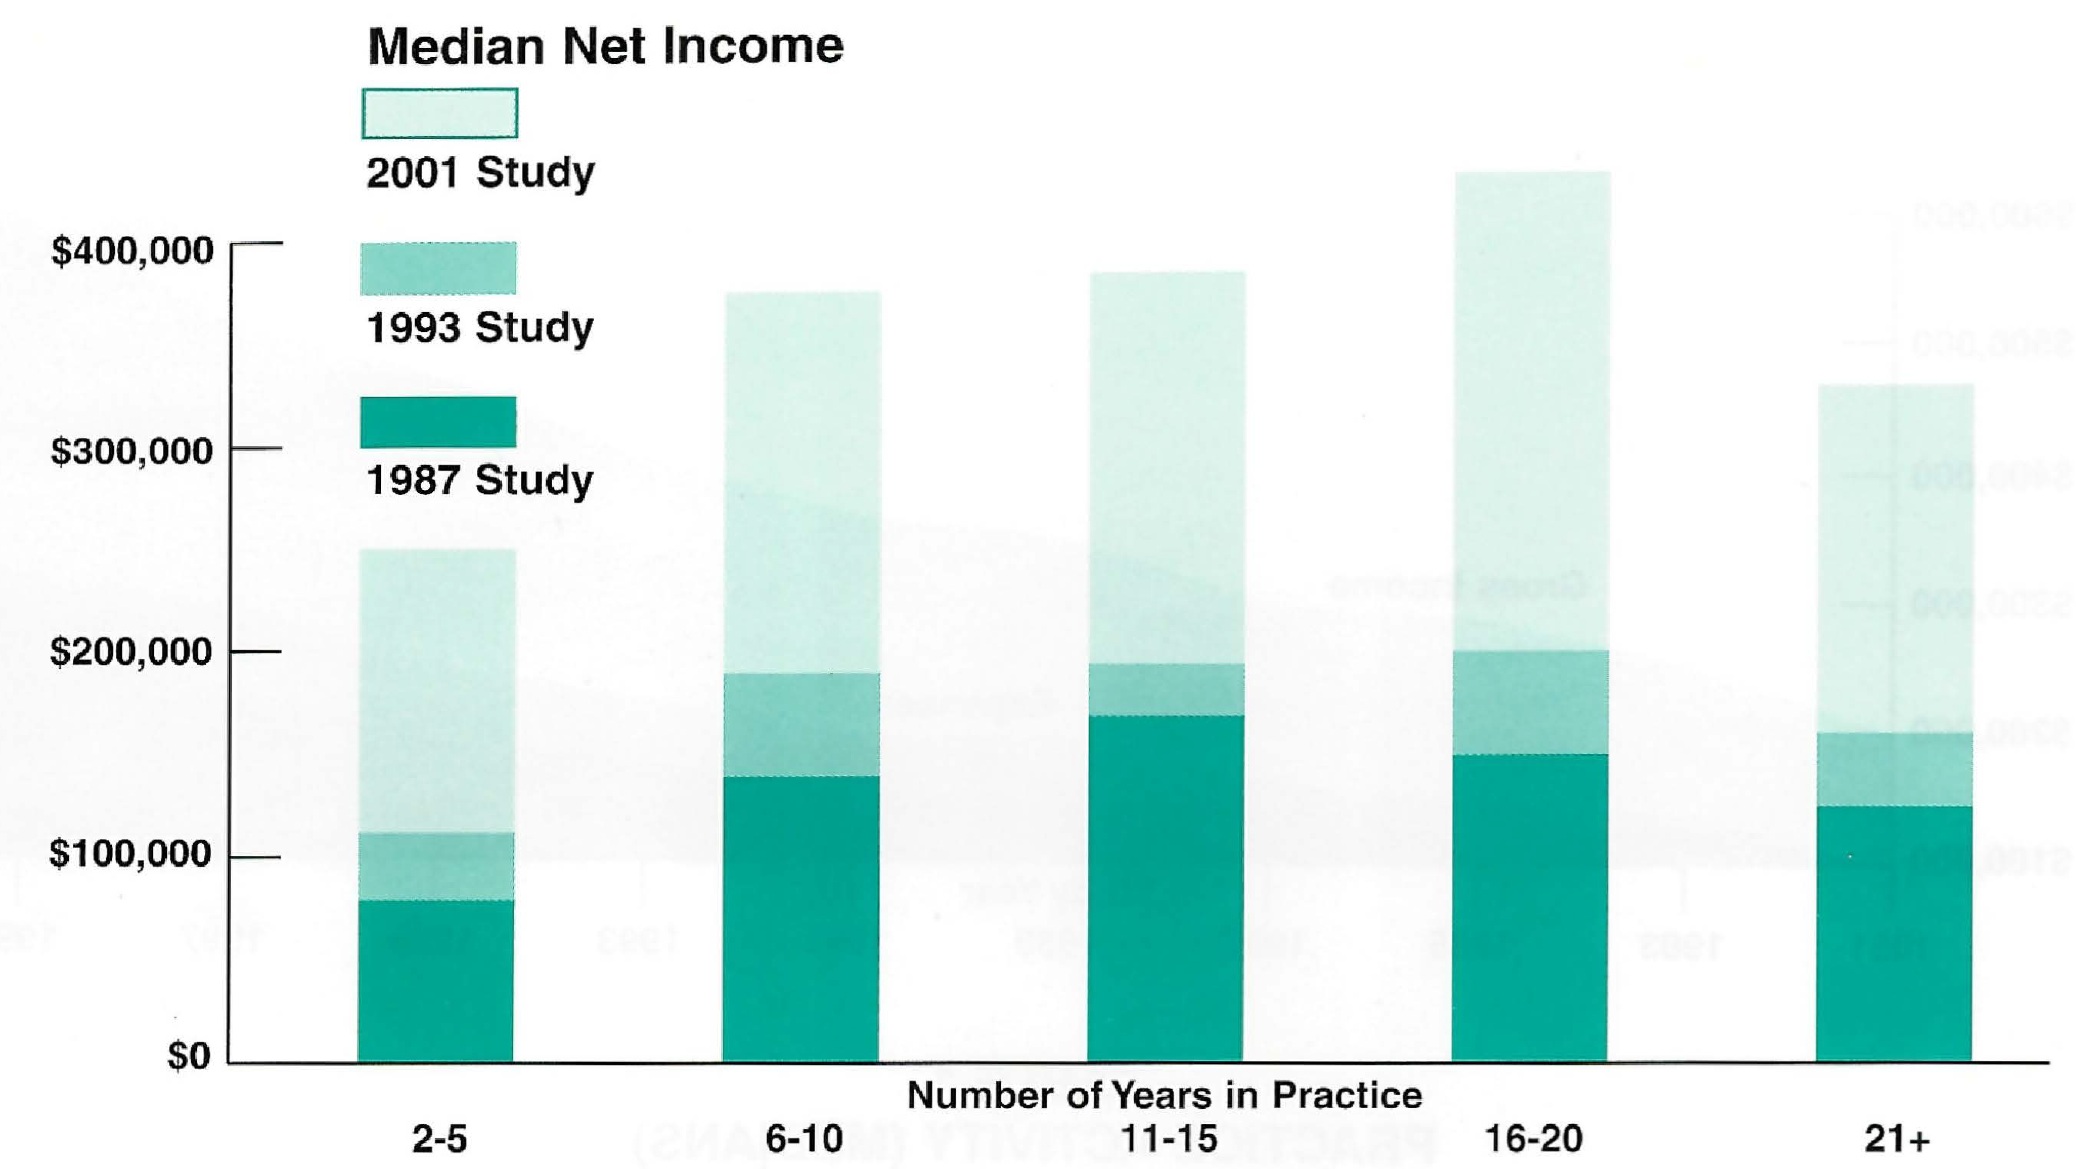
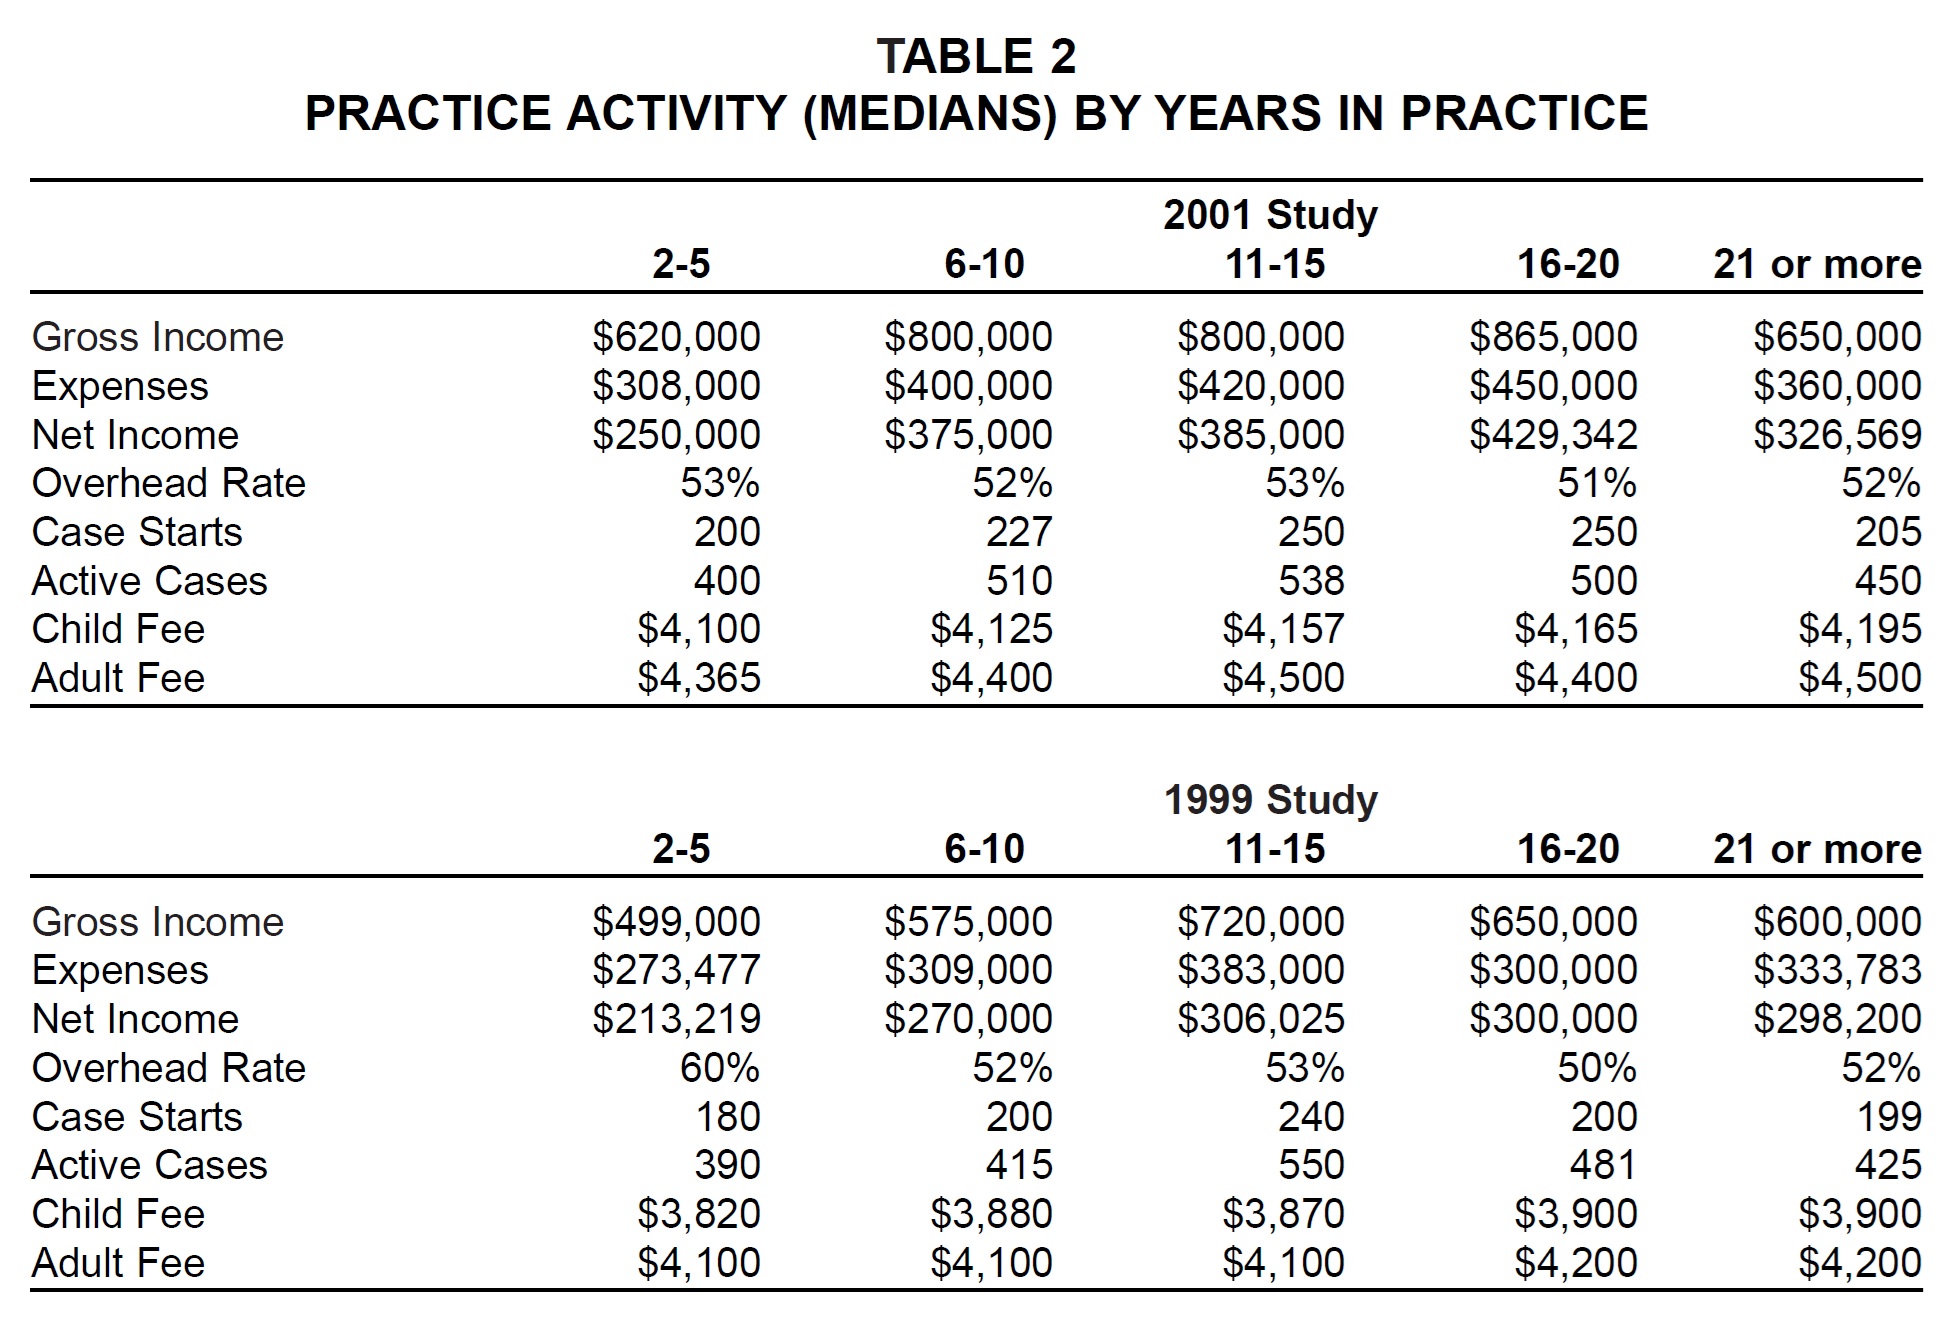
For the first time, respondents' median age and number of years in practice did not increase in the two years between reports. The median age remained at 49, and the median number of years in practice dropped from 19 to 18. Still, the peak of income production shifted from 11-15 years in practice, where it had been since this division was made in the 1987 Study, to 16-20 years in practice (Fig. 2).
The greatest increase in gross income since the previous survey (39%) was in the 6-to-10-year group, but the 16-to-20-year group showed the greatest increases in net income (43%) and expenses (50%). The newest practices had a considerable drop in the median overhead rate, with other groups staying about the same. As in previous studies, there was little difference in case fees relative to years in practice (Table 2).
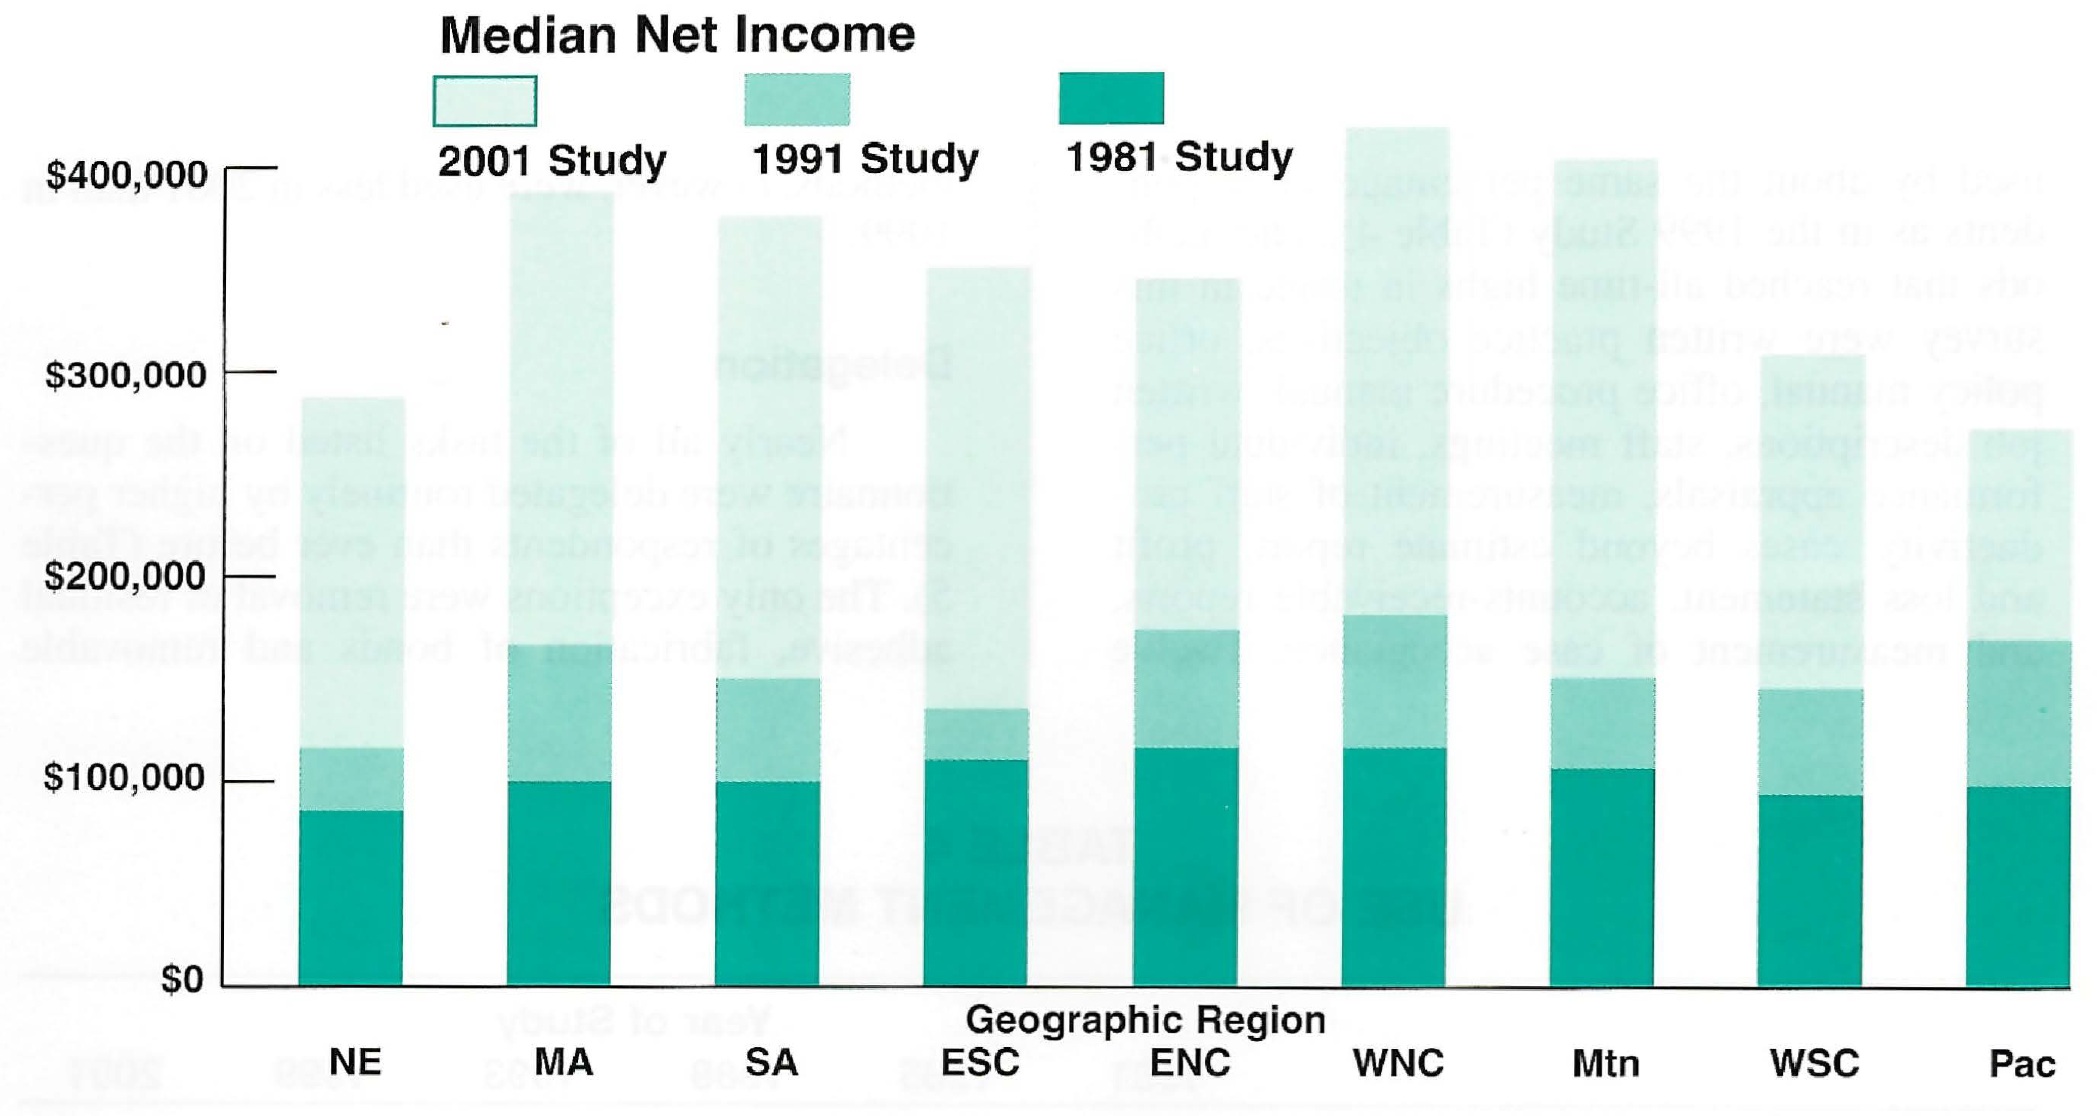
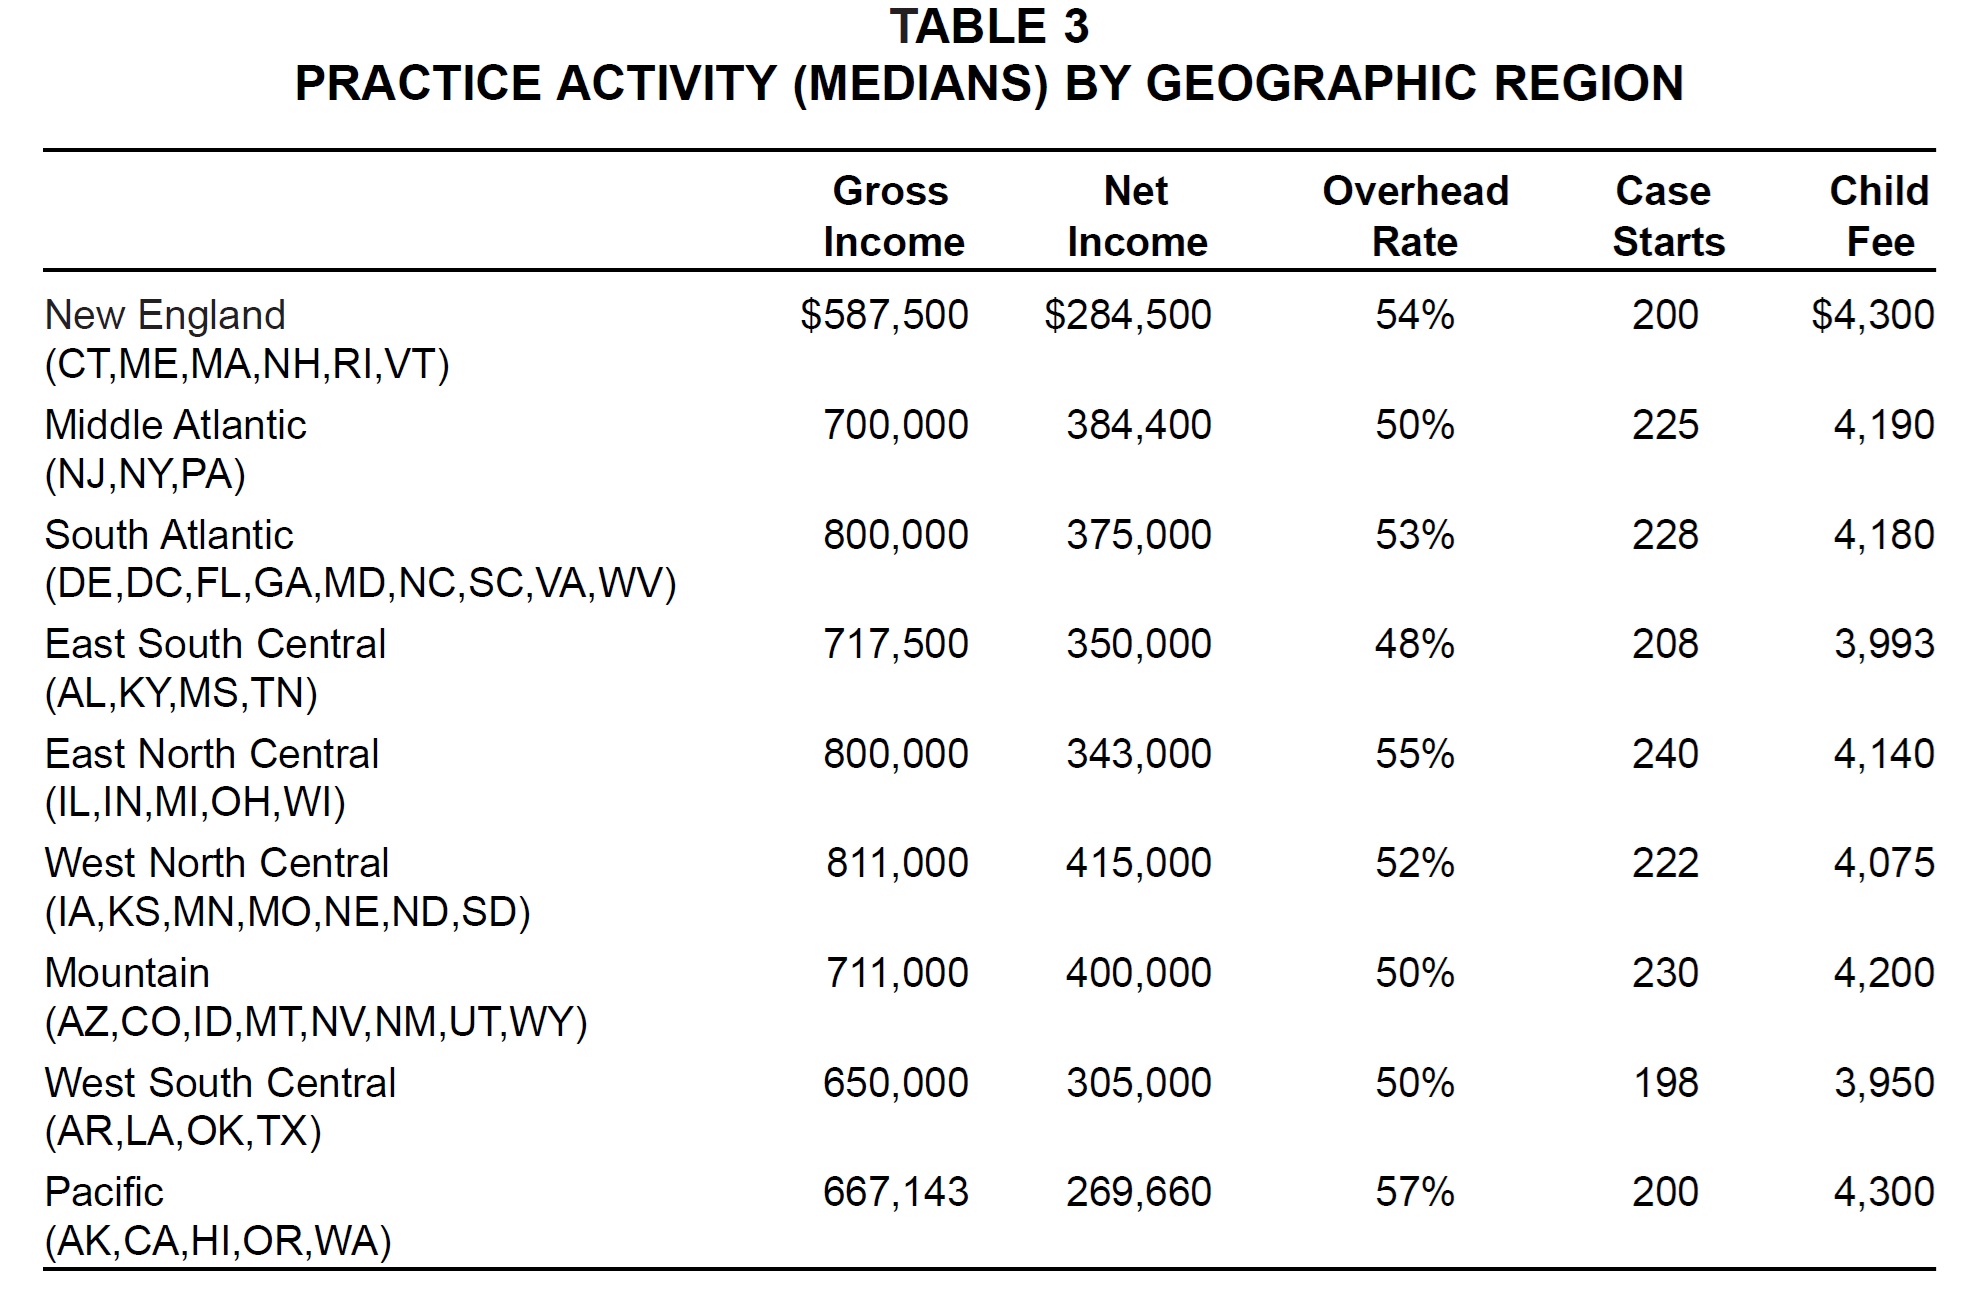
Geographic Region
Respondents in every geographic region reported higher median gross income than in the 1999 Study, with the greatest increases (27%) in the Middle Atlantic and South Atlantic regions (Fig. 3). Median net income increased in every region except New England and the Pacific; these two areas, along with the West North Central region, also showed increases in median overhead rates.
Median case starts increased across the country, led by the Mountain (17%) and East North Central (14%) regions. Two-year increases in median child fees were around 8% in every region except the West South Central, where fees rose only about 3% (Table 3).
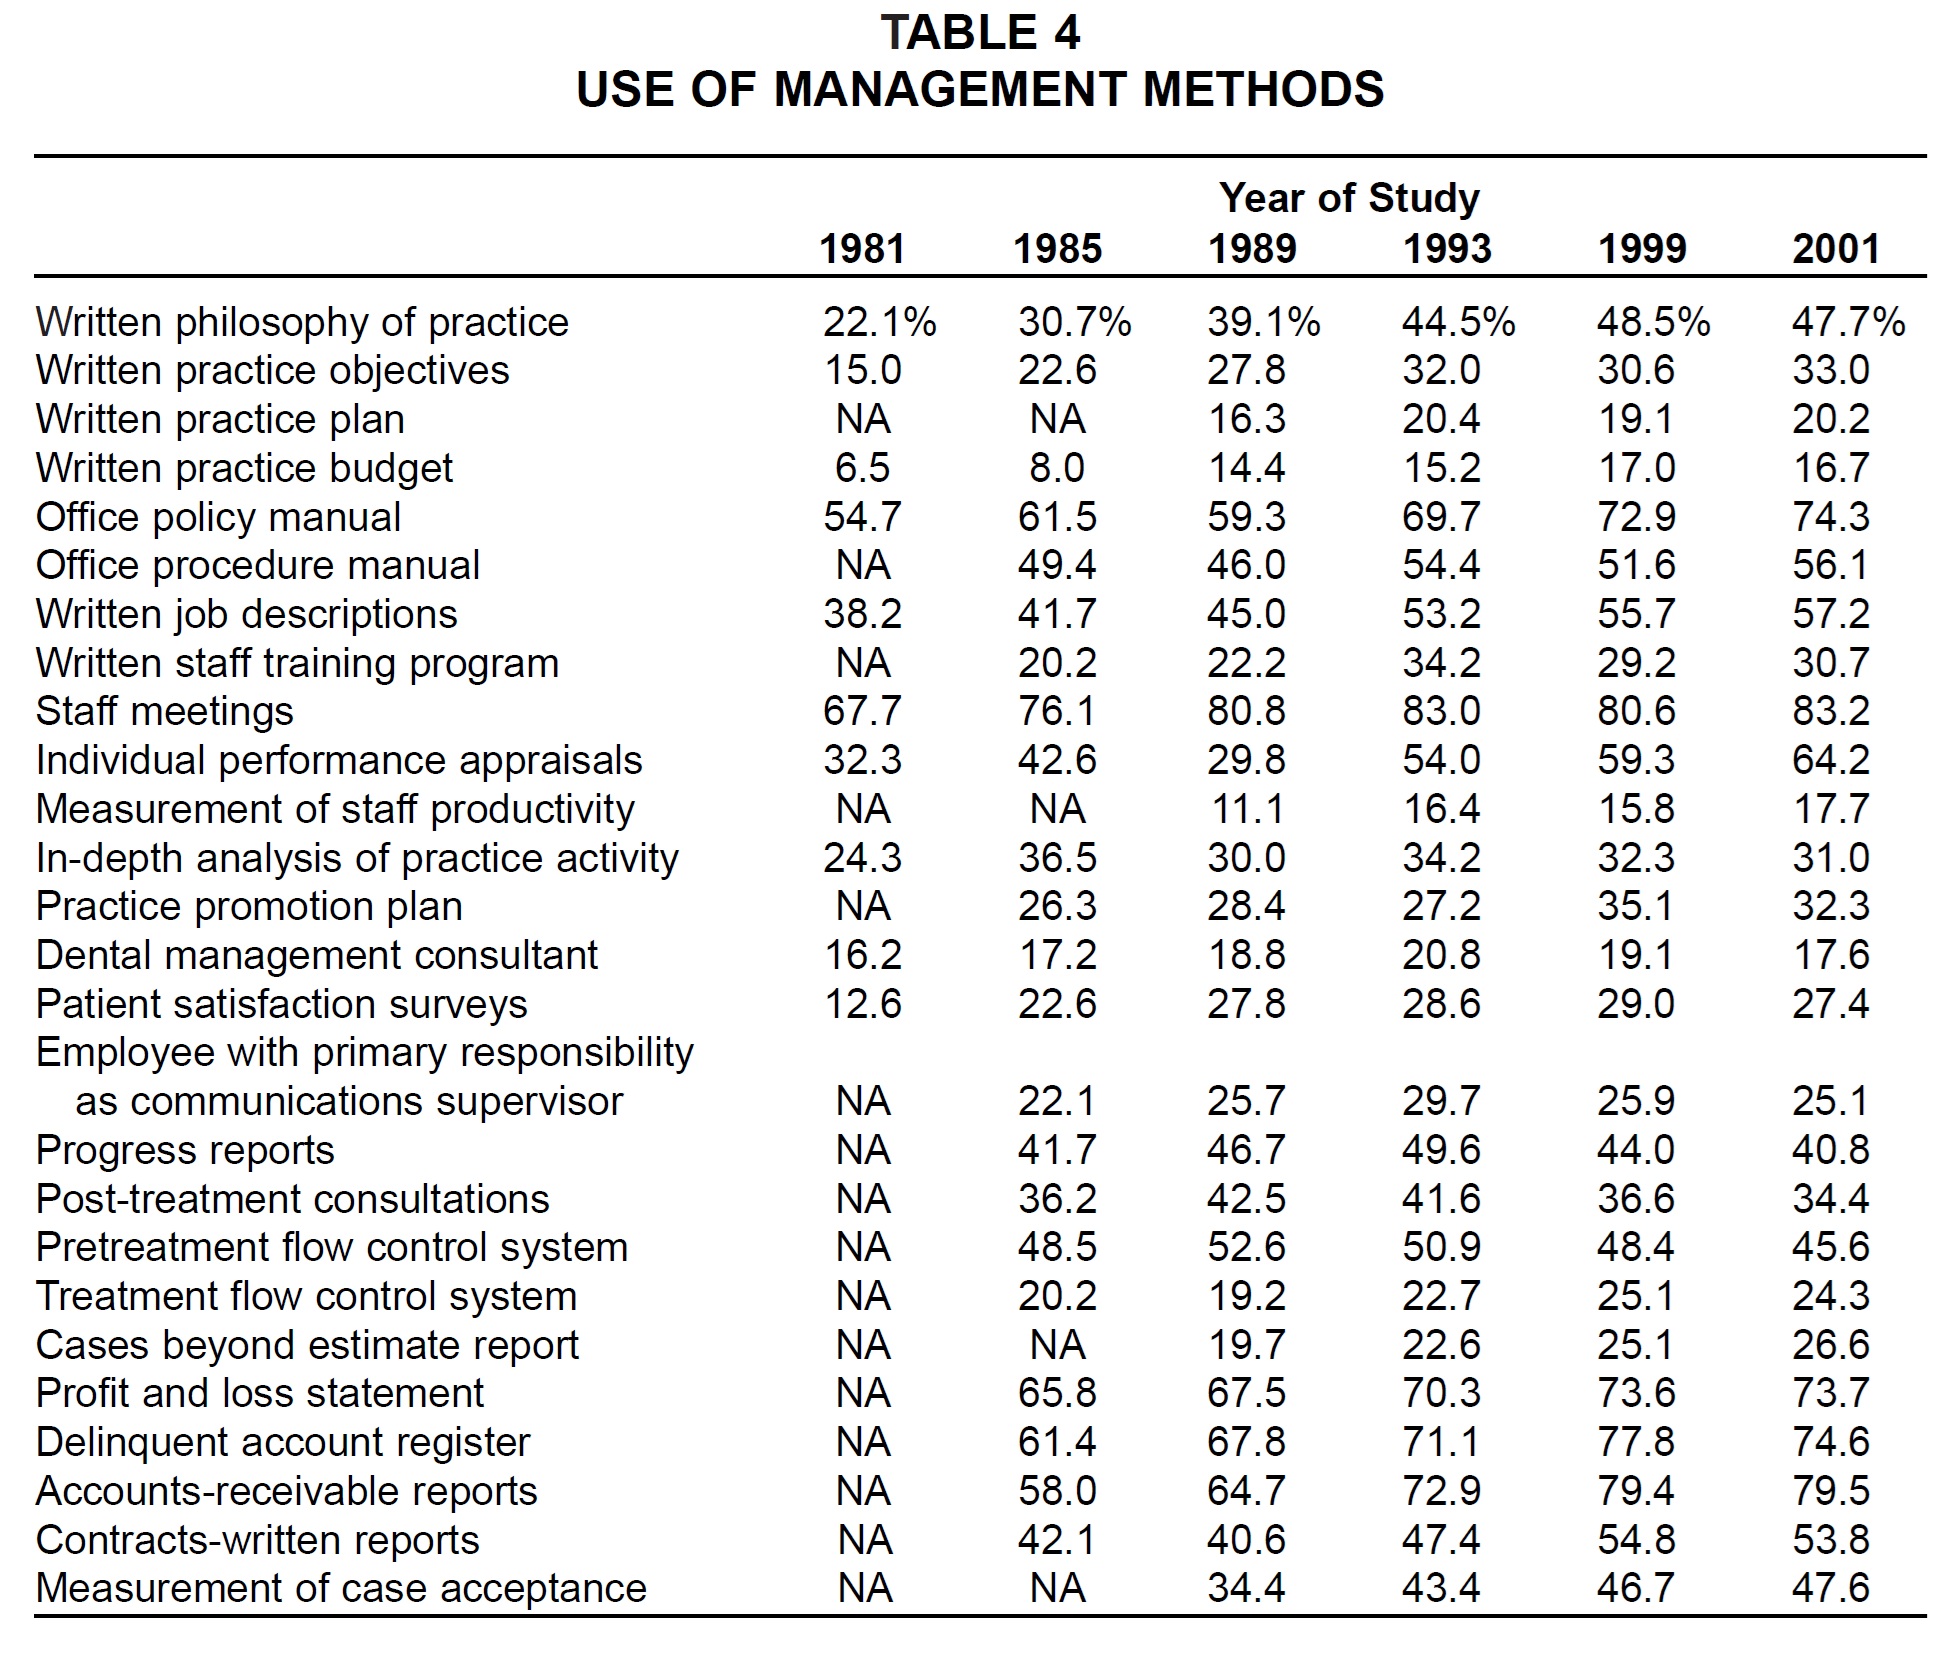
Use of Management Methods
Most of the management methods surveyed were used by about the same percentage of respondents as in the 1999 Study (Table 4). The methods that reached all-time highs in usage in this survey were written practice objectives, office policy manual, office procedure manual, written job descriptions, staff meetings, individual performance appraisals, measurement of staff productivity, cases beyond estimate report, profit and loss statement, accounts-receivable reports, and measurement of case acceptance. Twelve methods, however, were used less in 2001 than in 1999.
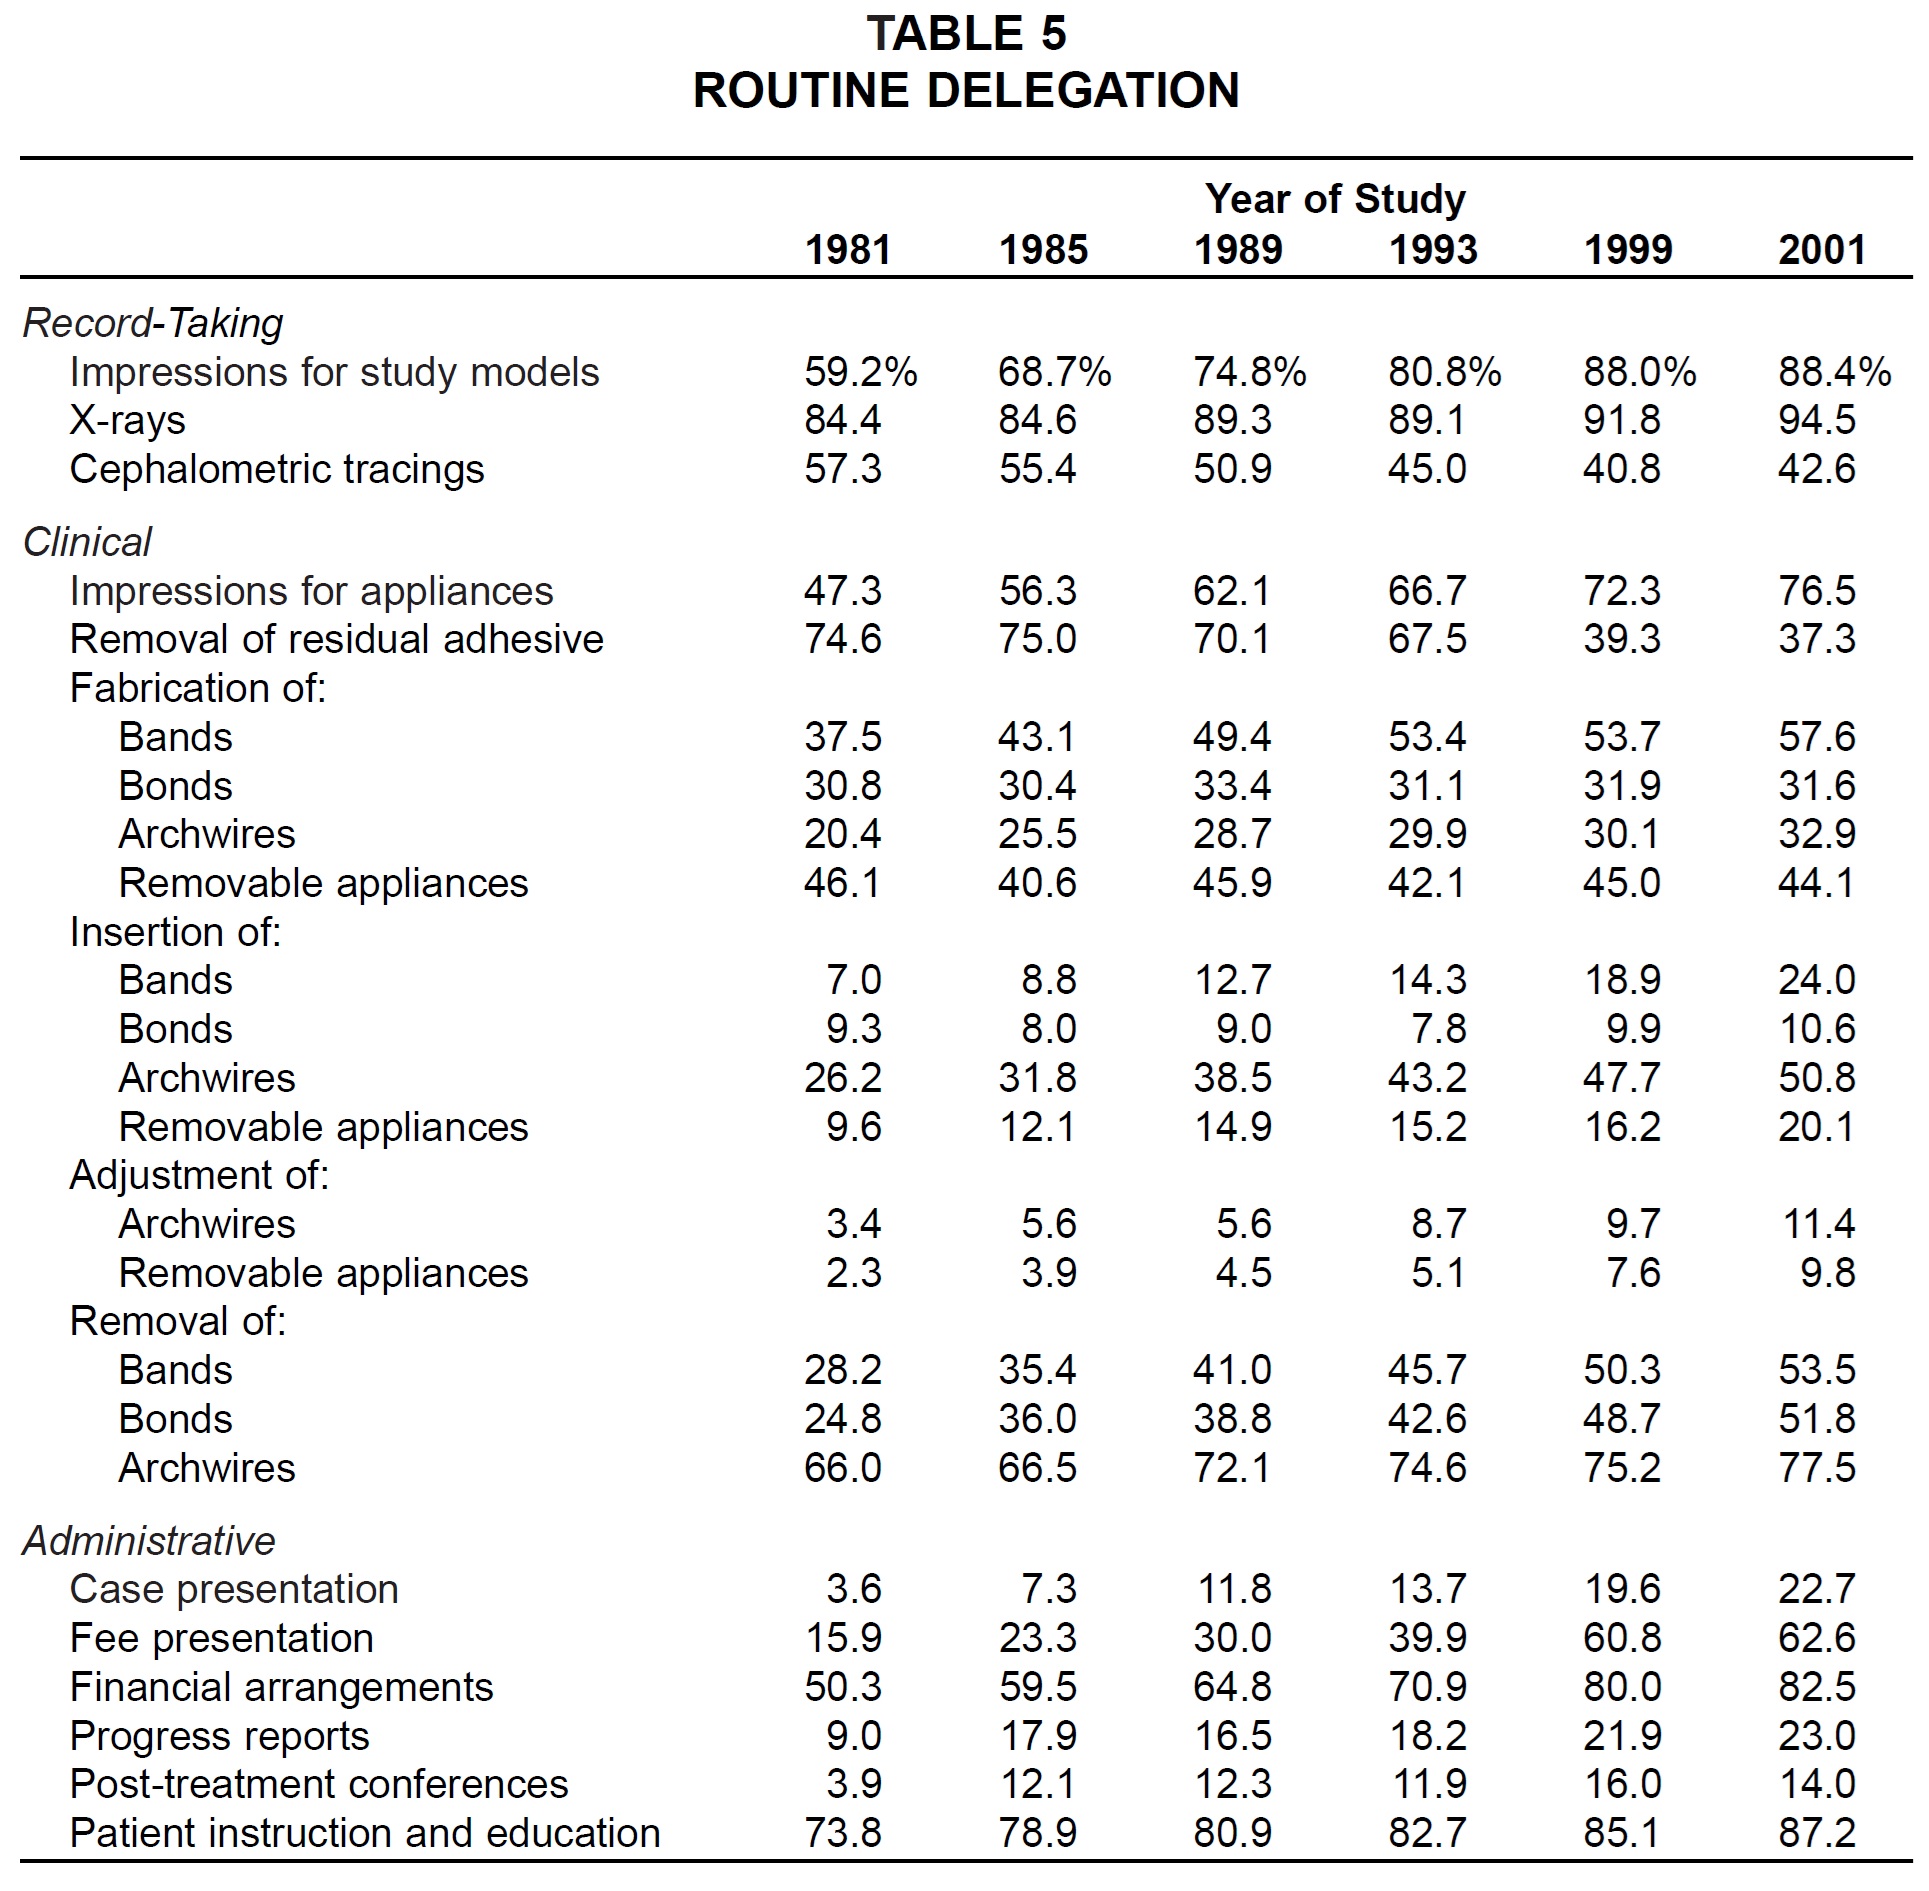
Delegation
Nearly all of the tasks listed on the questionnaire were delegated routinely by higher percentages of respondents than ever before (Table 5). The only exceptions were removal of residual adhesive, fabrication of bonds and removable appliances, progress reports, and post-treatment conferences.
The tasks routinely delegated by more than 80% of the sample were x-rays, impressions for study models, patient instruction and education, and financial arrangements.
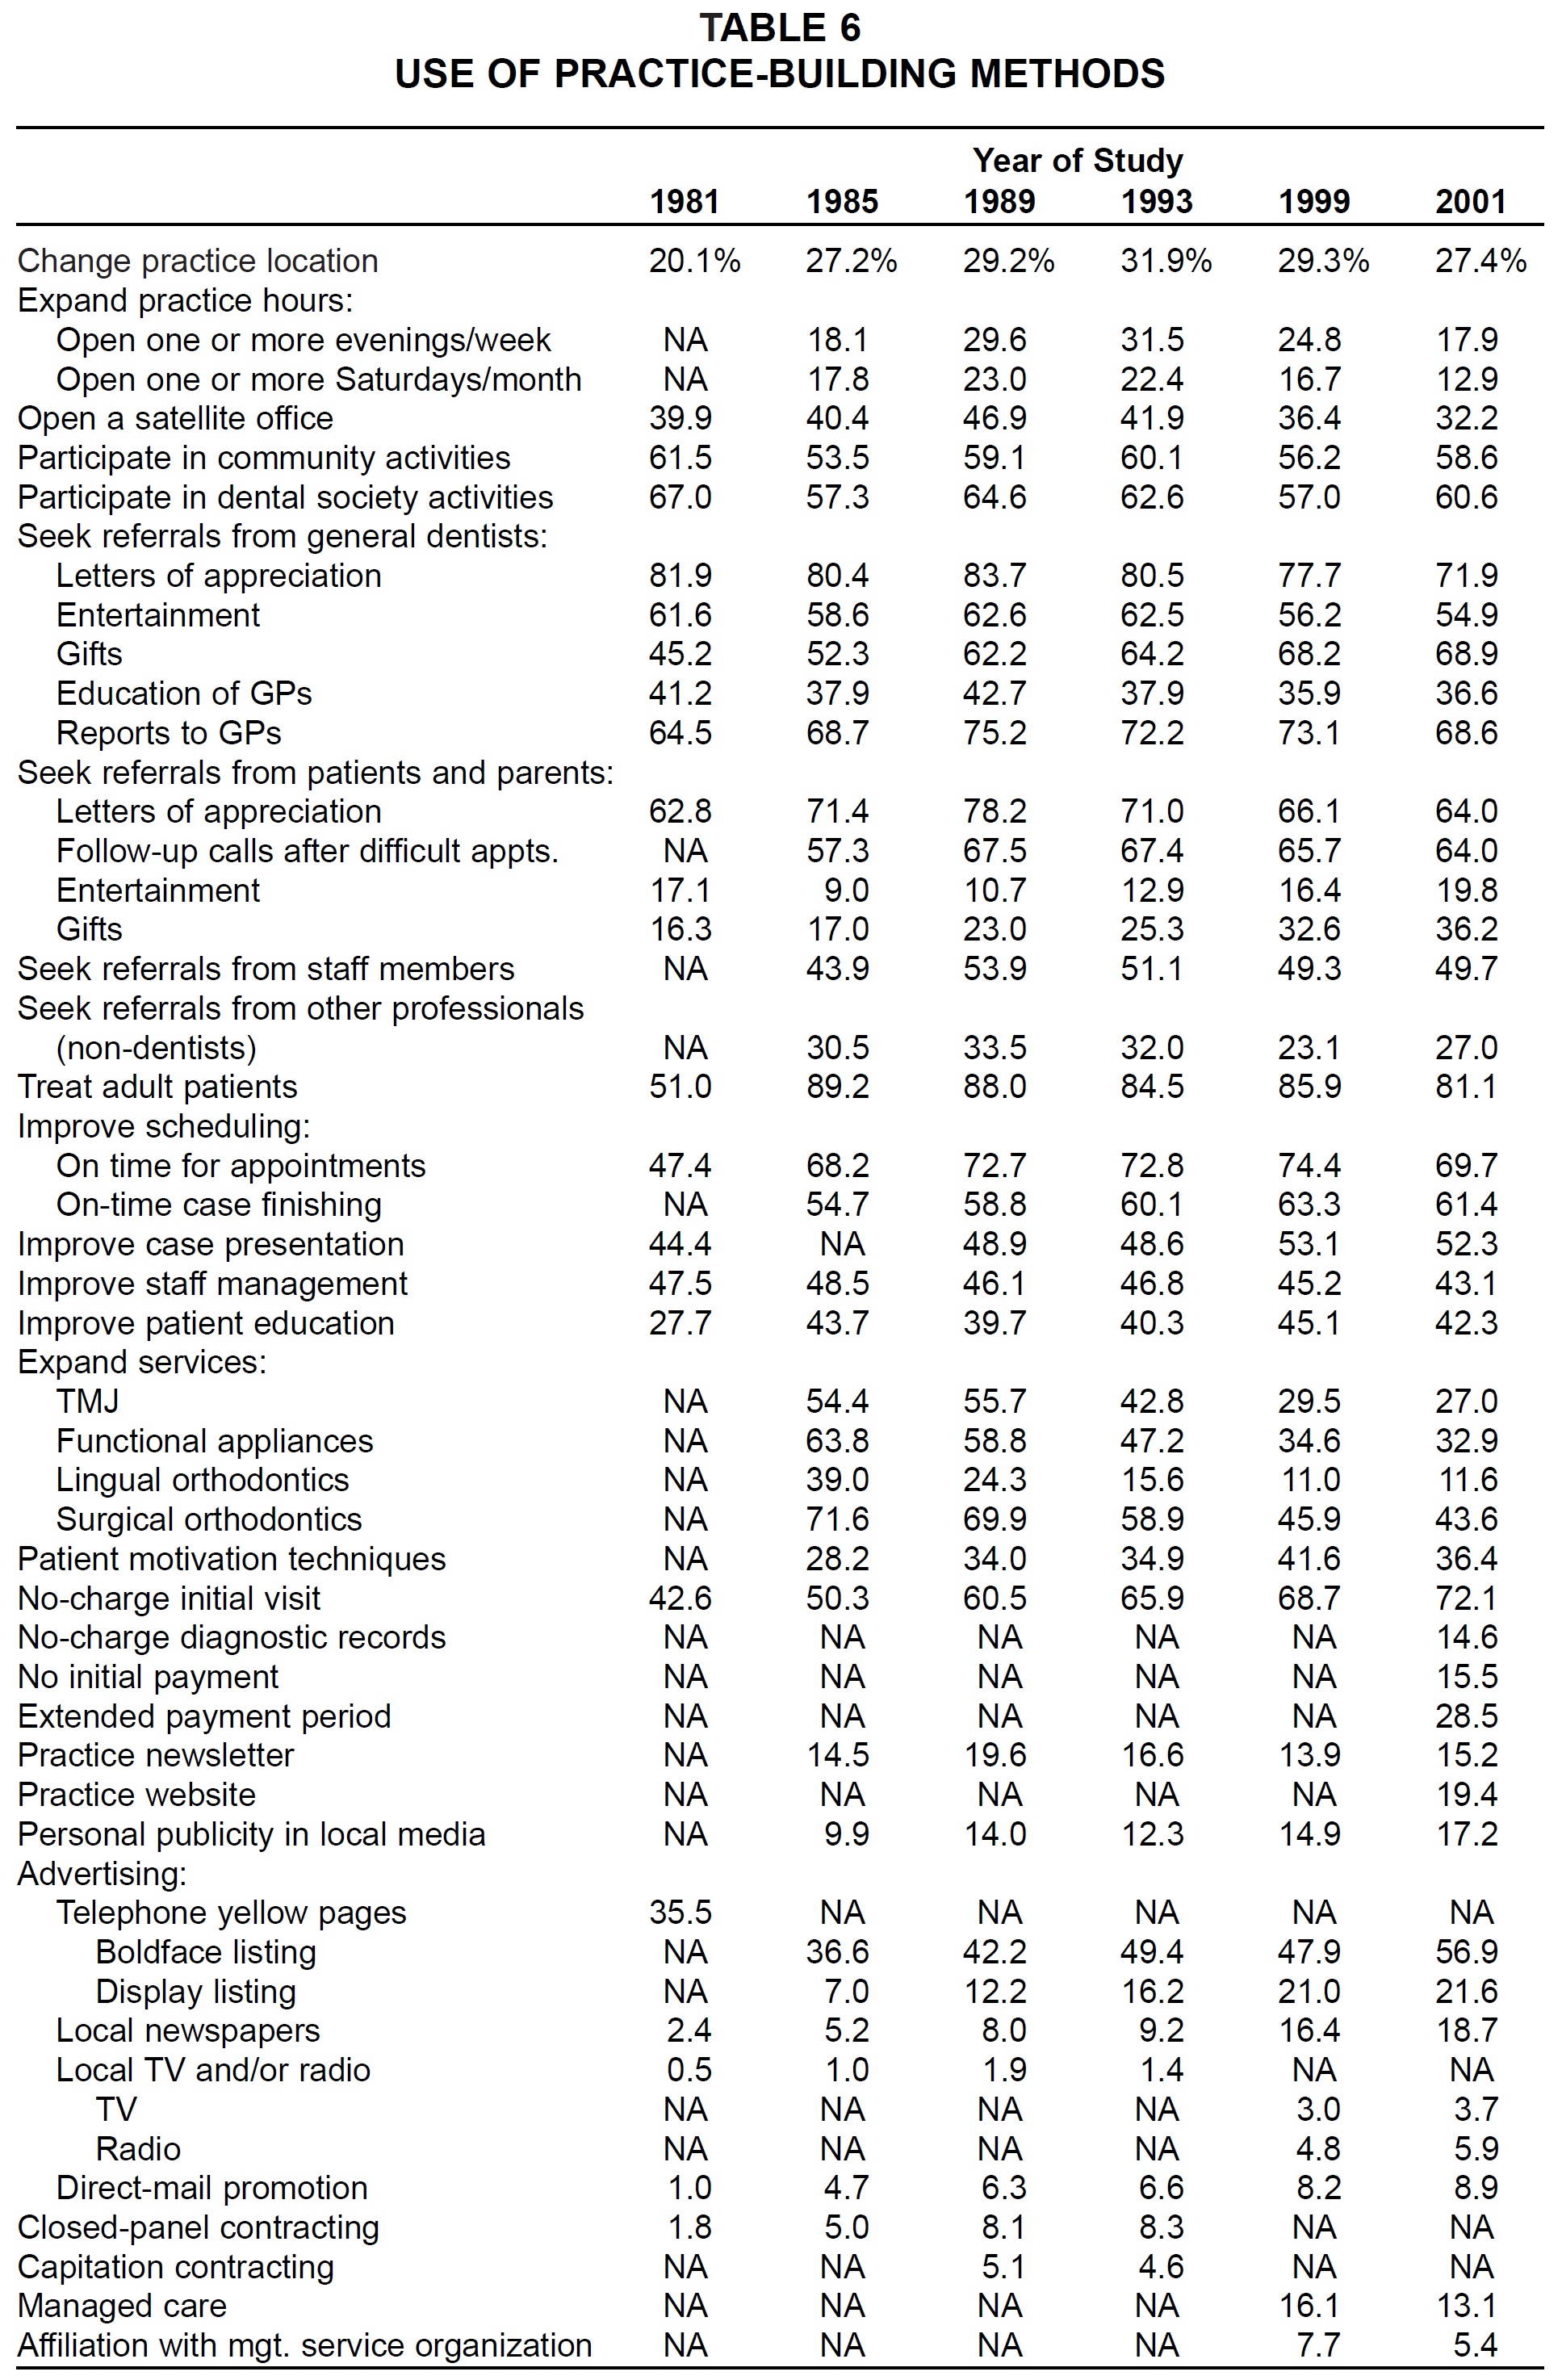
Use of Practice-Building Methods
Of the 42 practice-building methods surveyed, 20 were used by fewer respondents than in the 1999 Study (Table 6). Ten methods were used by greater percentages of respondents than ever before, including entertainment of and gifts to patients and parents, no-charge initial visit, personal publicity in local media, and all forms of advertising.
Sources of Referrals
As in past studies, virtually every respondent reported receiving referrals from general dentists and patients (Table 7). The percentages reporting referrals from other specialists, personal contacts, transfer cases, staff members, other professionals, and dental referral services continued their gradual declines since this item was first surveyed in the 1983 Study. On the other hand, slightly more practices used the yellow pages and commercial advertising for referrals than in the 1999 Study. Dental franchises, direct mail, and managed care were used by fewer respondents than in 1999.
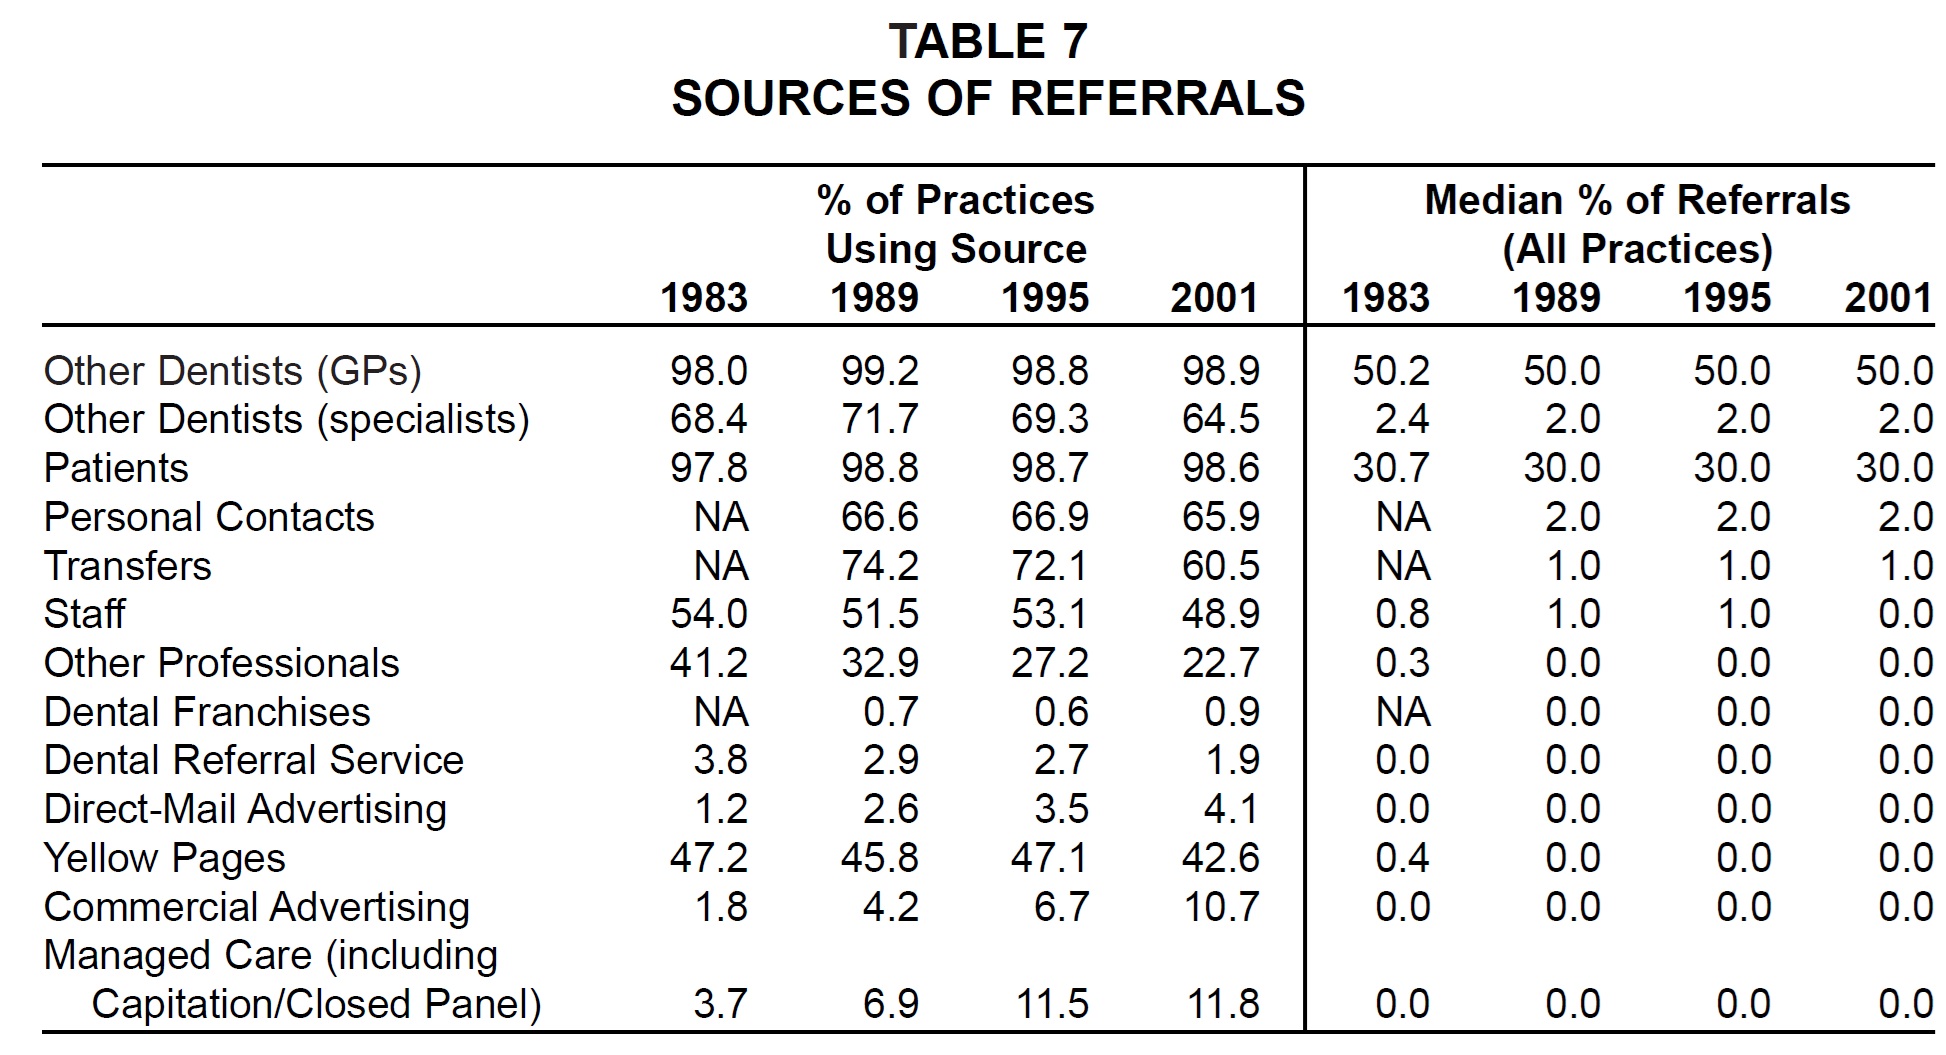
As in every previous survey, general dental referrals accounted for a median of 50% of all referrals, patients for a median of 30%, and other sources for a median of 2% or less. (The columns of percentages in the table do not add up to 100% because medians are reported instead of means.)
(Continued in the November 2001 issue.)
-
 DR. GOTTLIEB
 -
 DR. NELSON
 -
 MR. VOGELS
Dr. Nelson is Director and Research Consultant, Nelson Associates, Nederland, CO.