2021 JCO Orthodontic Practice Study Part 2: Practice Success
There's No Perfect Malocclusion
In Part 1 of this three-part report (JCO, October 2021), we described trends in orthodontic economics and practice administration since our first JCO Orthodontic Practice Study was conducted in 1981. This month, we discuss the factors that appear to be related to practice success in terms of net income and case starts.
Part 1 detailed the methodology used in this online survey. When reading the tables in Part 2, remember that we use a probability level (“p” value) of .01 instead of the more usual .05 for tests of statistical significance, since the large number of variables in the Study makes it more likely that the results could be affected by chance. Annual statistics such as income and numbers of cases always refer to the preceding calendar year (in this case, 2020). Especially noteworthy results in each table are highlighted in bold.
Net Income Level
To allow closer analysis of practice success, respondents to every Practice Study have been divided into three net income groups of approximately equal numbers. This year, the categories were high (more than $695,000), moderate ($380,000-695,000), and low (less than $380,000). The 2021 tables include all respondents; before the 2015 Study, about one-quarter of the overall sample was omitted to highlight the differences among net income categories.
High net income respondents showed nearly four times the gross income and about three and a half times the number of case starts and active cases as in the low net income practices (Table 11). Since they also reported much lower overhead rates, their net income was more than four and a half times higher. There was not as much discrepancy in net income per case (although the difference was still statistically significant), which might have been affected by the inclusion of COVID relief funds in some practices’ income figures. The reported figures for COVID relief include respondents who reported receiving zero relief, which tends to skew the means lower than if medians had been used.
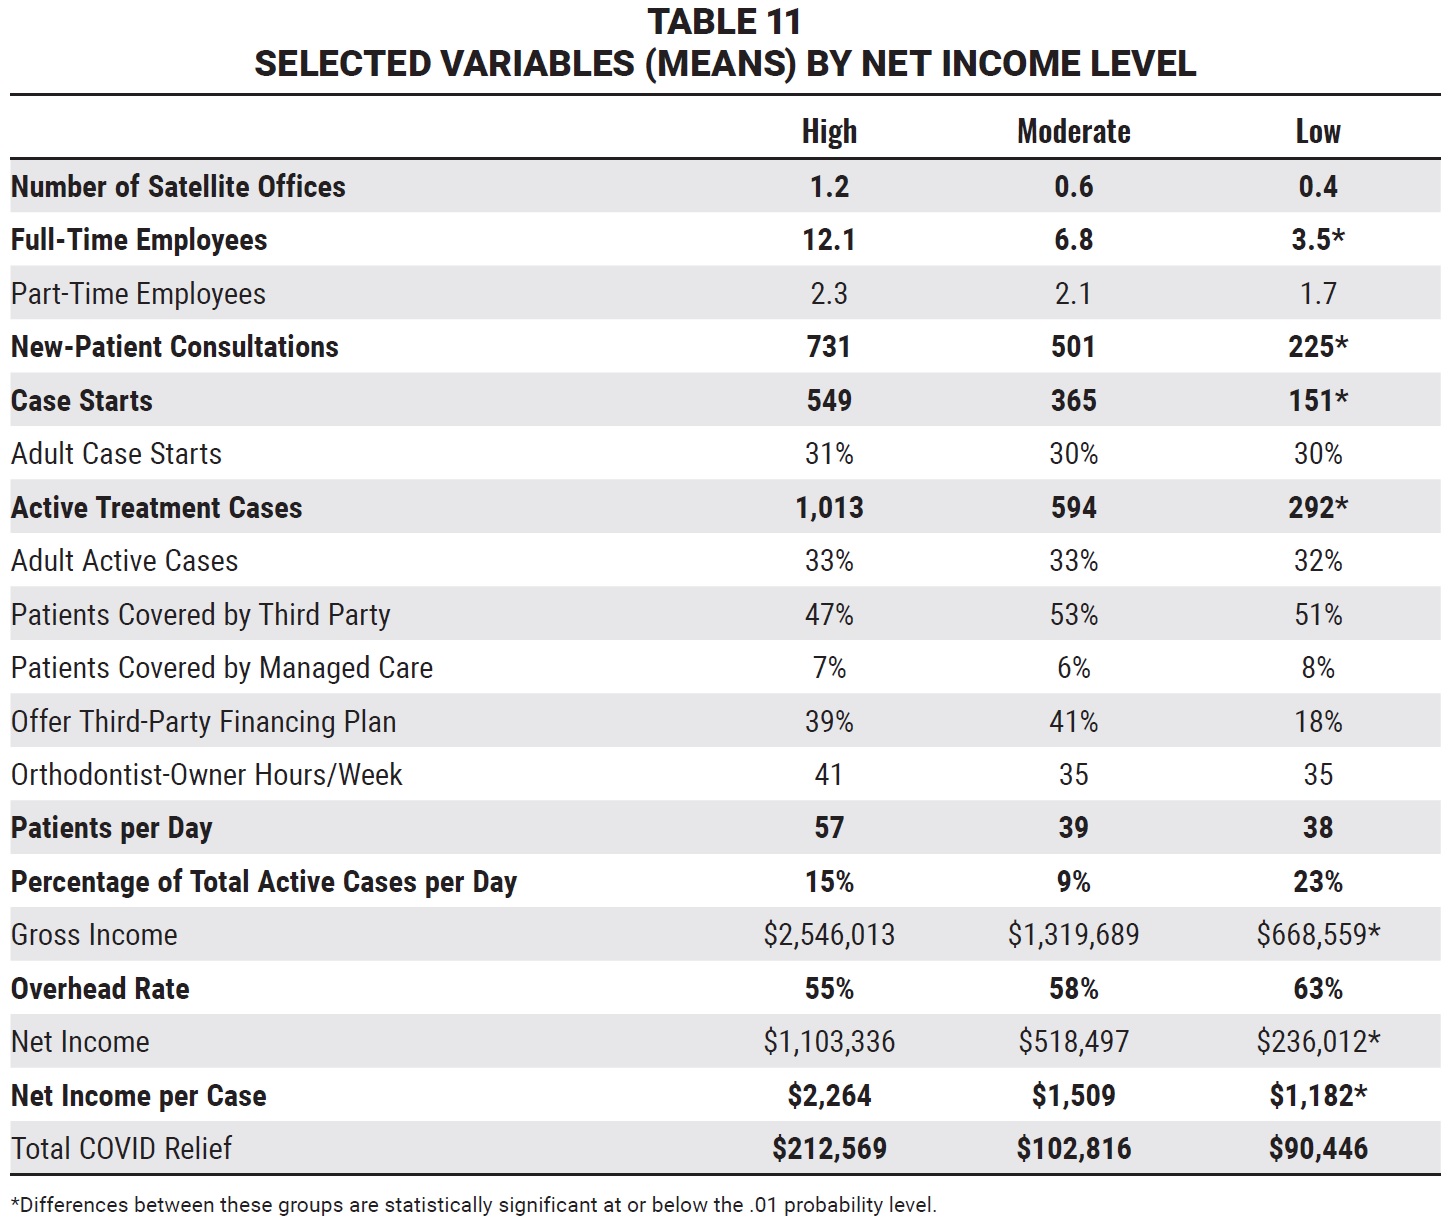
High net income respondents indicated that they saw more patients per day than other practices did, but they saw a lower percentage of their total active cases per day compared with low net income practices. The high net income practices had notably more satellite offices than other practices did, and they also generated more new-patient consultations, case starts, and active treatment cases per office location (Fig. 3). There were no significant differences in percentages of adult, third-party, or managed-care patients or in hours per week worked by the owners.
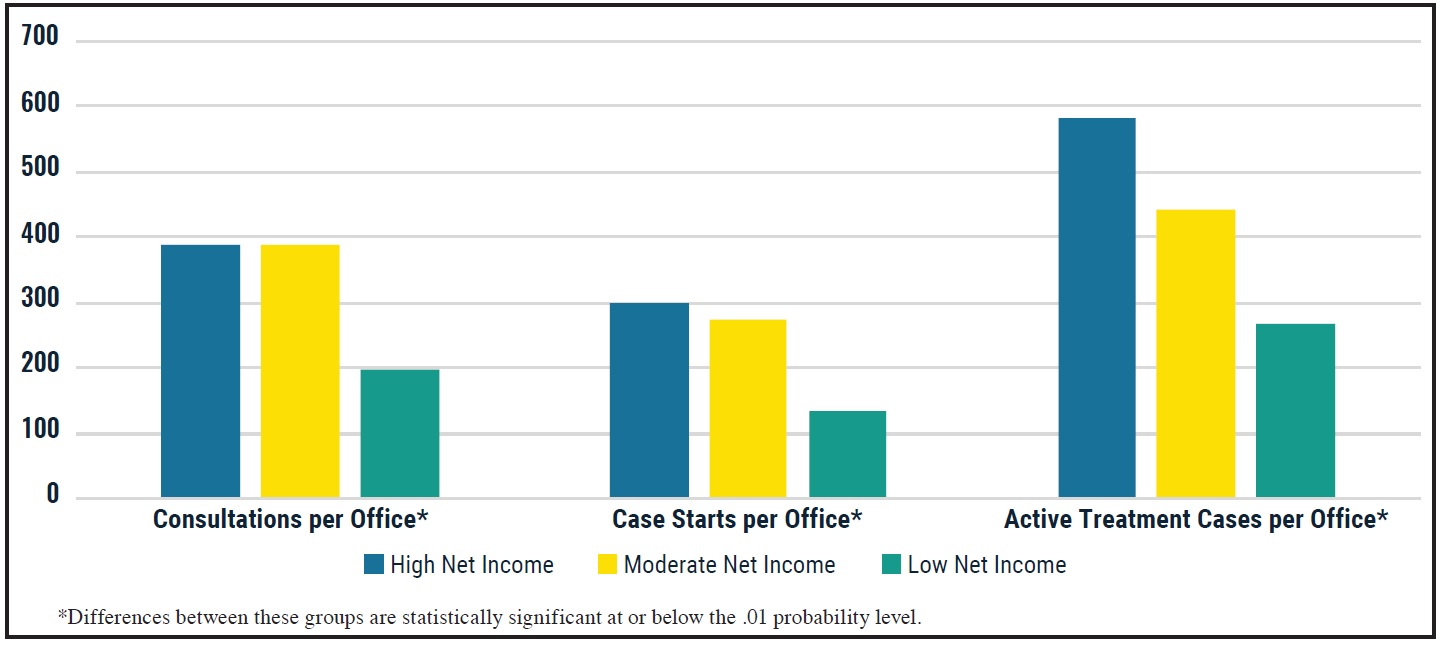
Fig. 3 Practice activity by office location (including satellites).
Categories of years in practice were adjusted slightly in this survey to provide more equal numbers in each group. Still, the patterns of net income levels by years in practice were similar to those reported in the 2019 Study (Table 12). Respondents in practice for 14-21 years had the highest percentage in the high net income category, while those in practice for 21-30 years had the highest percentage in the low net income category, followed closely by those in practice for 31 or more years.

No significant regional differences were noted in net income level, as in every survey since 2015, when the geographic regions were consolidated from nine to five (Table 13). The highest percentage of high net income practices was in the South; the highest percentage of low net income practices was in the Northeast.

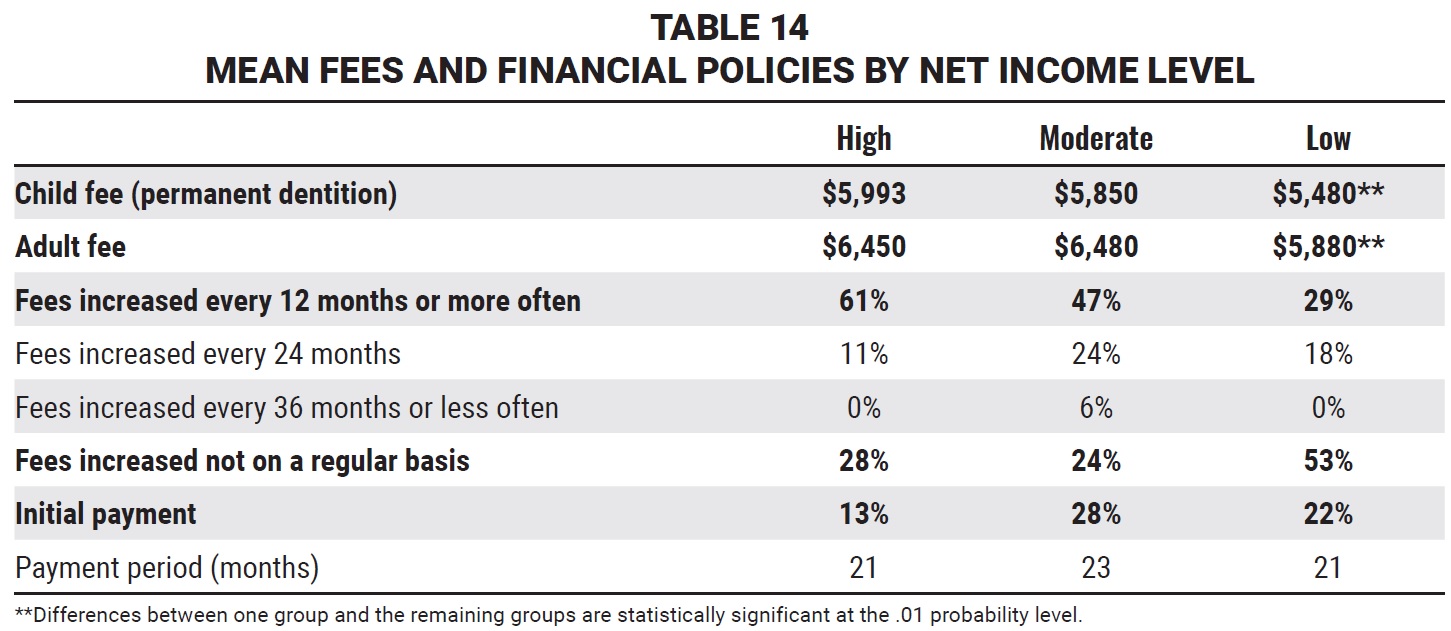
High net income respondents showed significantly higher child and adult case fees compared with the other categories, with greater differentials than in recent surveys (Table 14). The high net income practices also reported raising their fees more often, whereas the low net income practices were more likely to raise theirs on an irregular basis. While the mean payment period was about the same in each group, the high net income practices reported a notably lower mean initial payment.
Management Methods
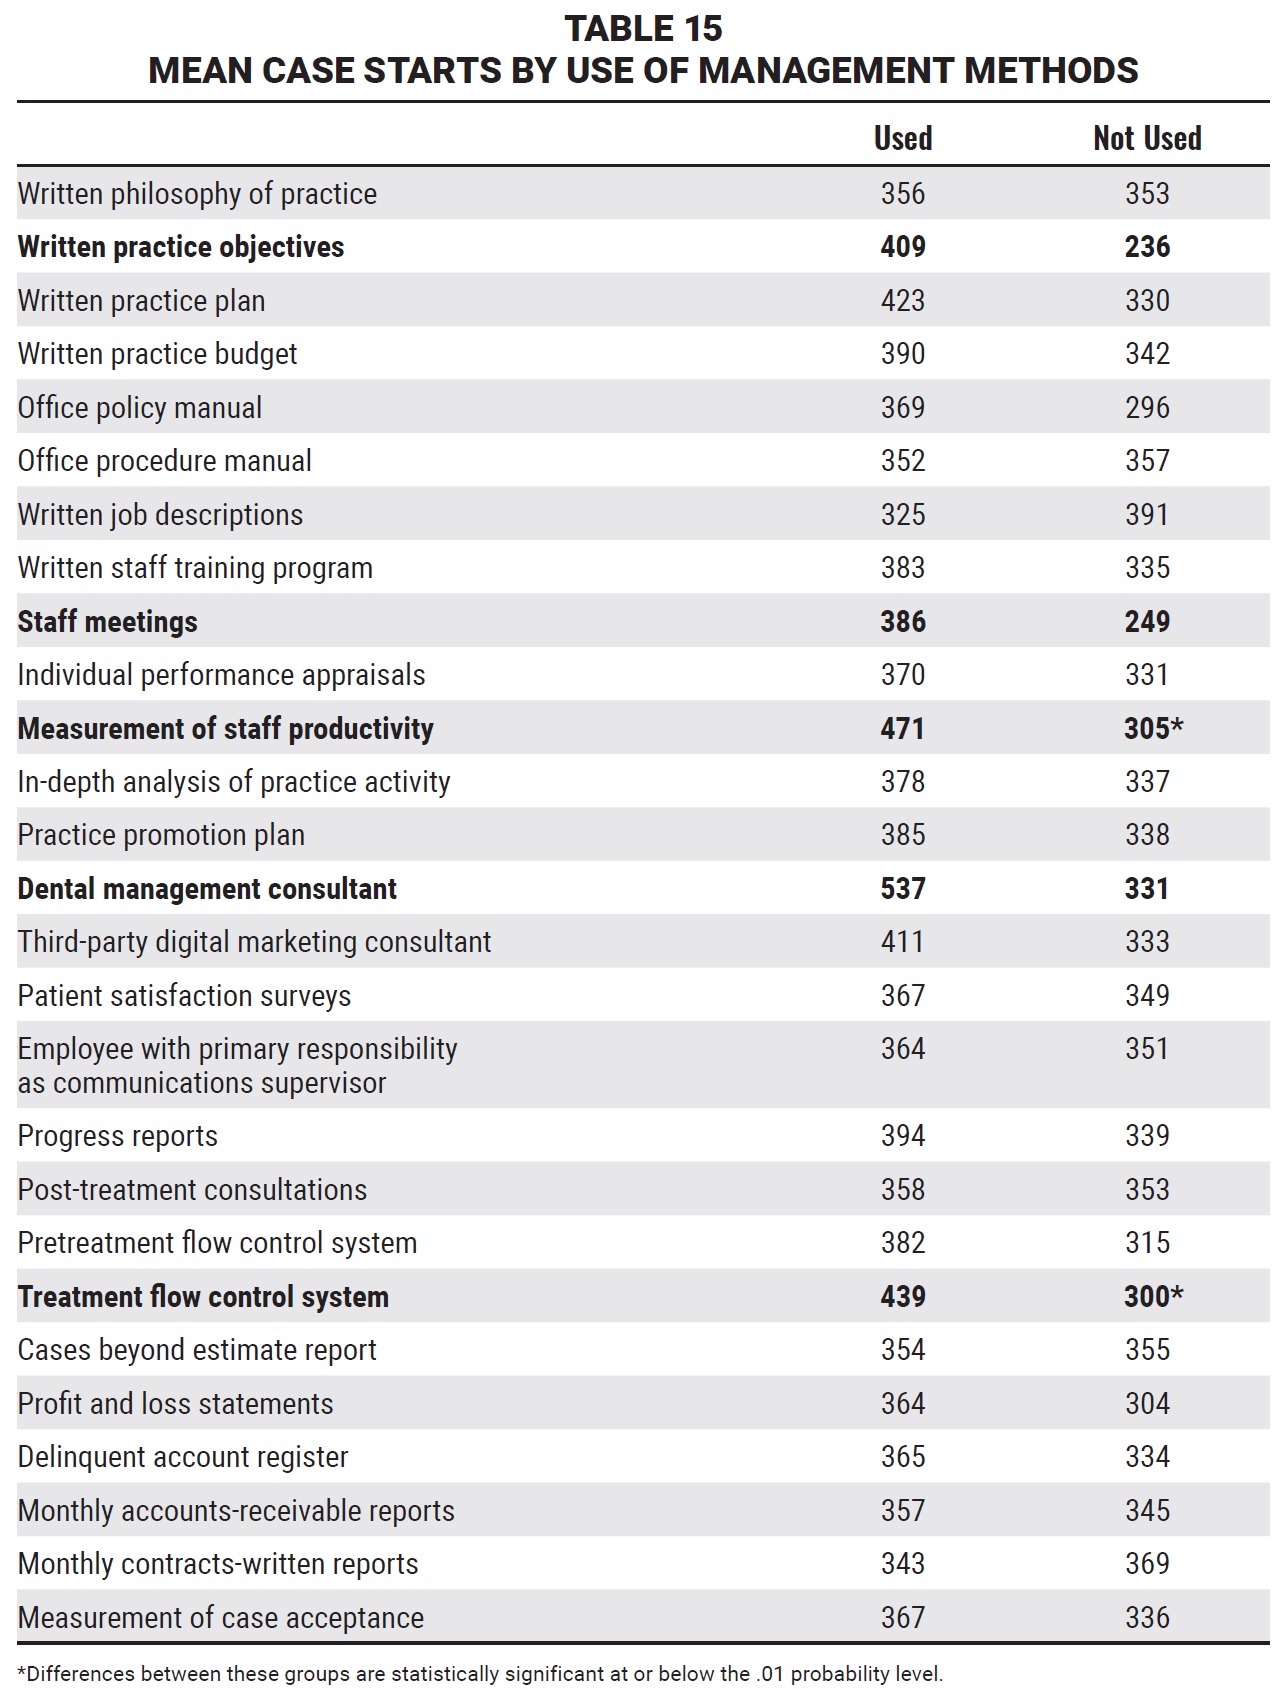
Users of most management methods listed in the survey indicated higher numbers of mean case starts than non-users did, as in every Practice Study to date (Table 15). The contrast was somewhat stronger than in the 2019 Study, with measurement of staff productivity and treatment flow control system showing significant differences and written practice objectives, staff meetings, and dental management consultant showing notable differences. Non-users reported more mean case starts than users of office procedure manual, written job descriptions, cases beyond estimate report, and monthly contracts-written reports.
Higher percentages of users were found in the high net income category than in the low net income category for 23 of the 27 management methods, the exceptions being office procedure manual, written job descriptions, post-treatment consultations, and cases beyond estimate report (Table 16).
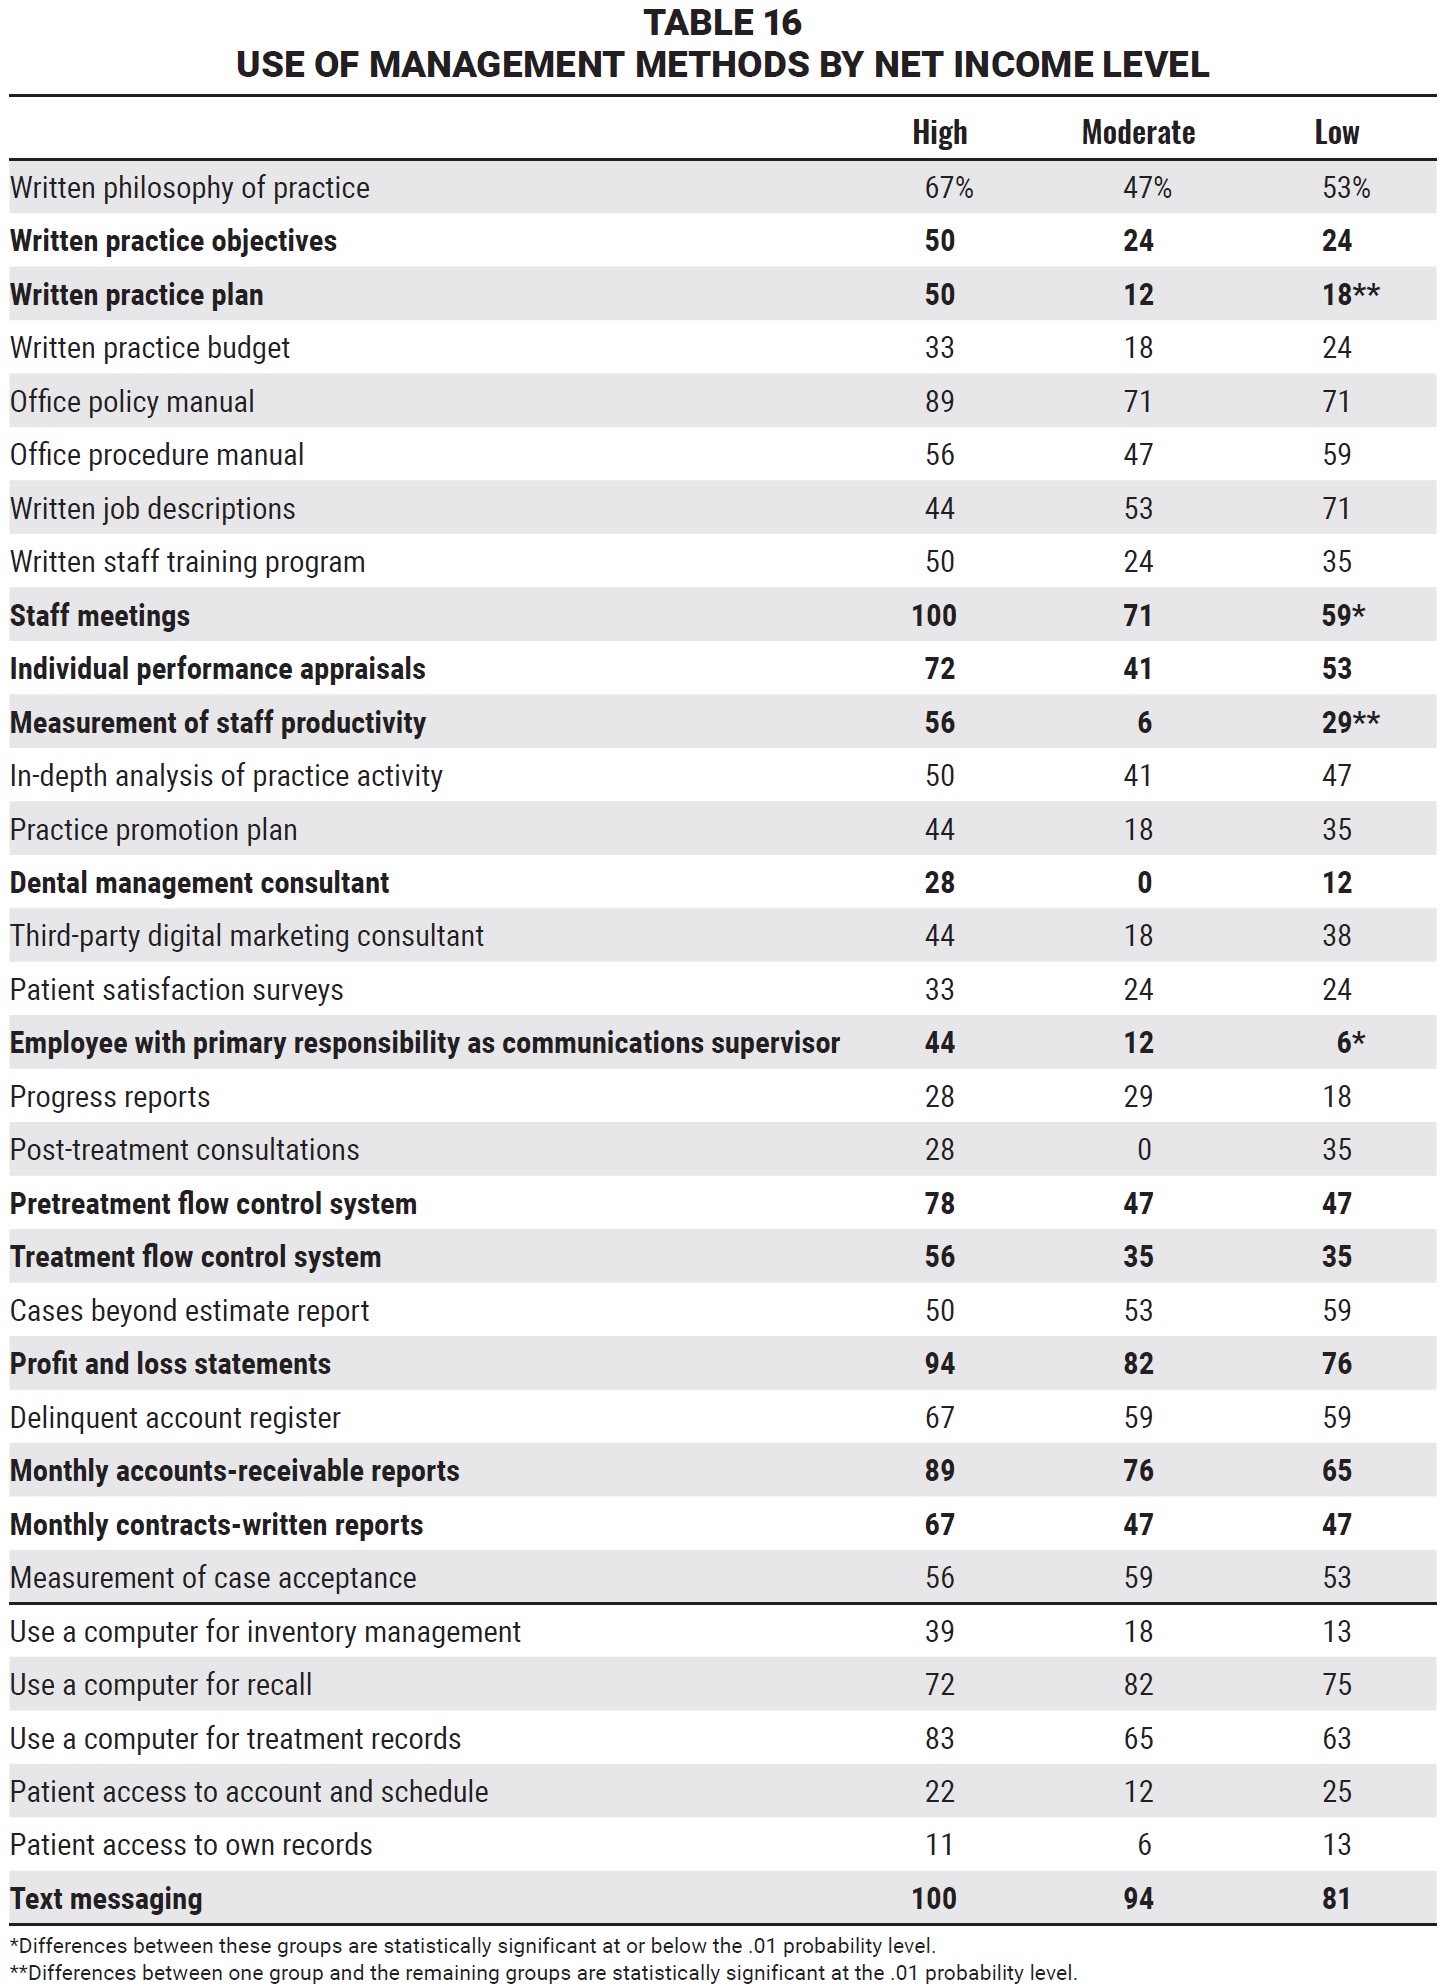
Again, the differences were clearer than in the 2019 Study—statistically significant for written practice plan, staff meetings, measurement of staff productivity, and employee with primary responsibility as communications supervisor, and noteworthy for written practice objectives, individual performance appraisals, dental management consultant, pretreatment flow control system, treatment flow control system, profit and loss statements, monthly accounts-receivable reports, and monthly contracts-written reports (Fig. 4).
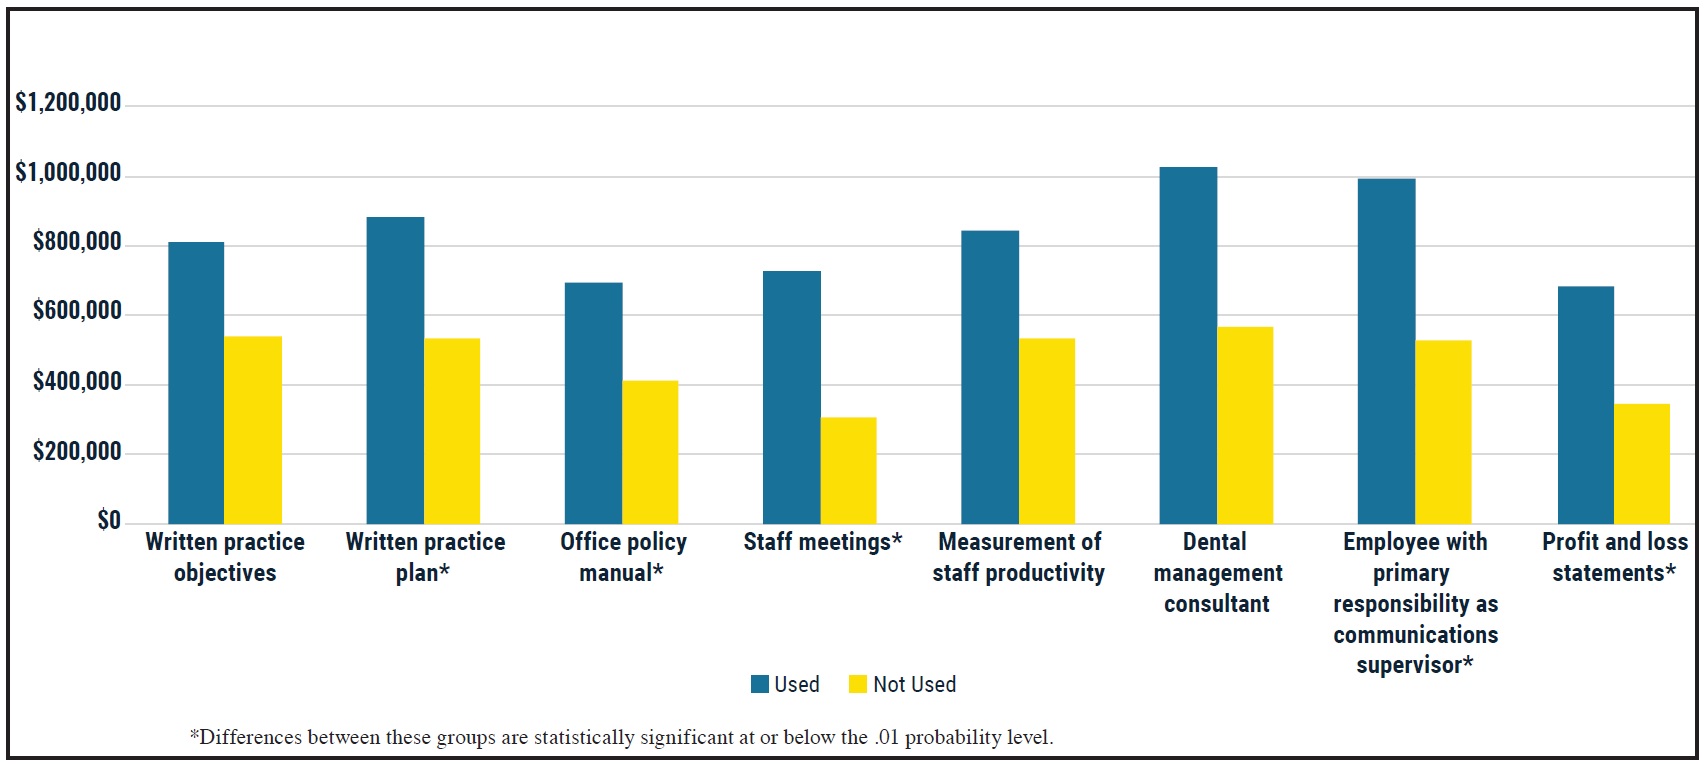
Fig. 4 Mean net income by use of various management methods.
There were no significant differences in usage of various computer functions by net income level, although 100% of the high net income practices reported using text messaging, compared with 81% of the low net income practices. The high net income respondents were also more likely than others to use computerized inventory management and treatment records.
In a comparison of the 2021 Practice Study with an average of the 2015, 2017, and 2019 surveys, overall usage of management methods has declined in all three net income categories, but relatively less among high net income practices (Table 17). (It should be noted that these are not the same individual respondents from survey to survey.) In the high net income group, usage increased from 2015-2019 to 2021 for measurement of staff productivity, treatment flow control system, written practice plan, staff meetings, dental management consultant, pretreatment flow control system, and office policy manual (in descending order of increase). The only other increases were recorded in the low net income category for cases beyond estimate report, in-depth analysis of practice activity, measurement of staff productivity, and written job descriptions.
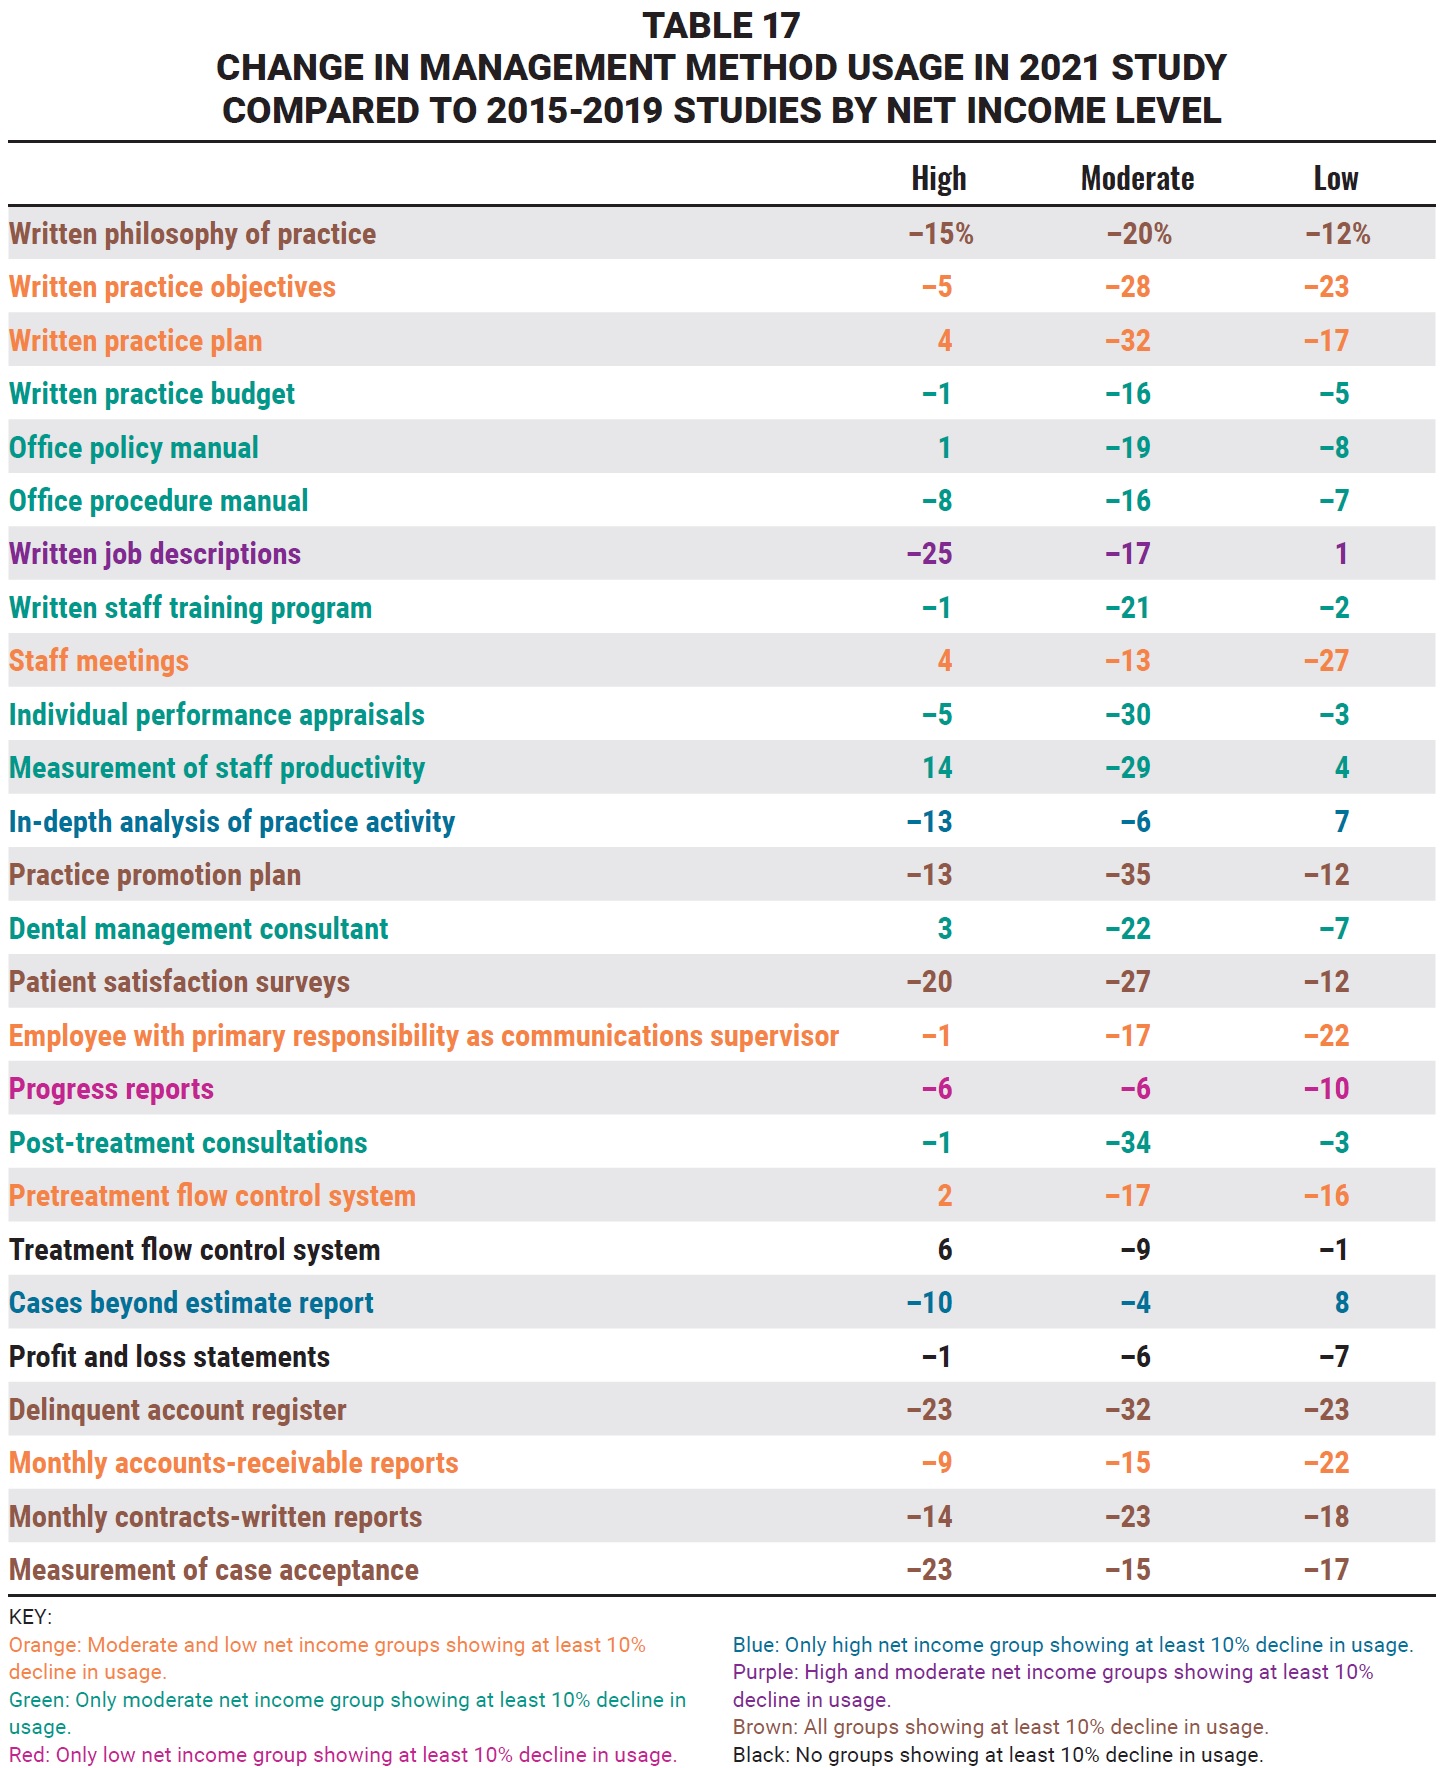
Declines in usage of at least 10% were found in all three income groups for practice promotion plan, patient satisfaction surveys, delinquent account register, monthly contracts-written reports, measurement of case acceptance, and written philosophy of practice (Fig. 5).
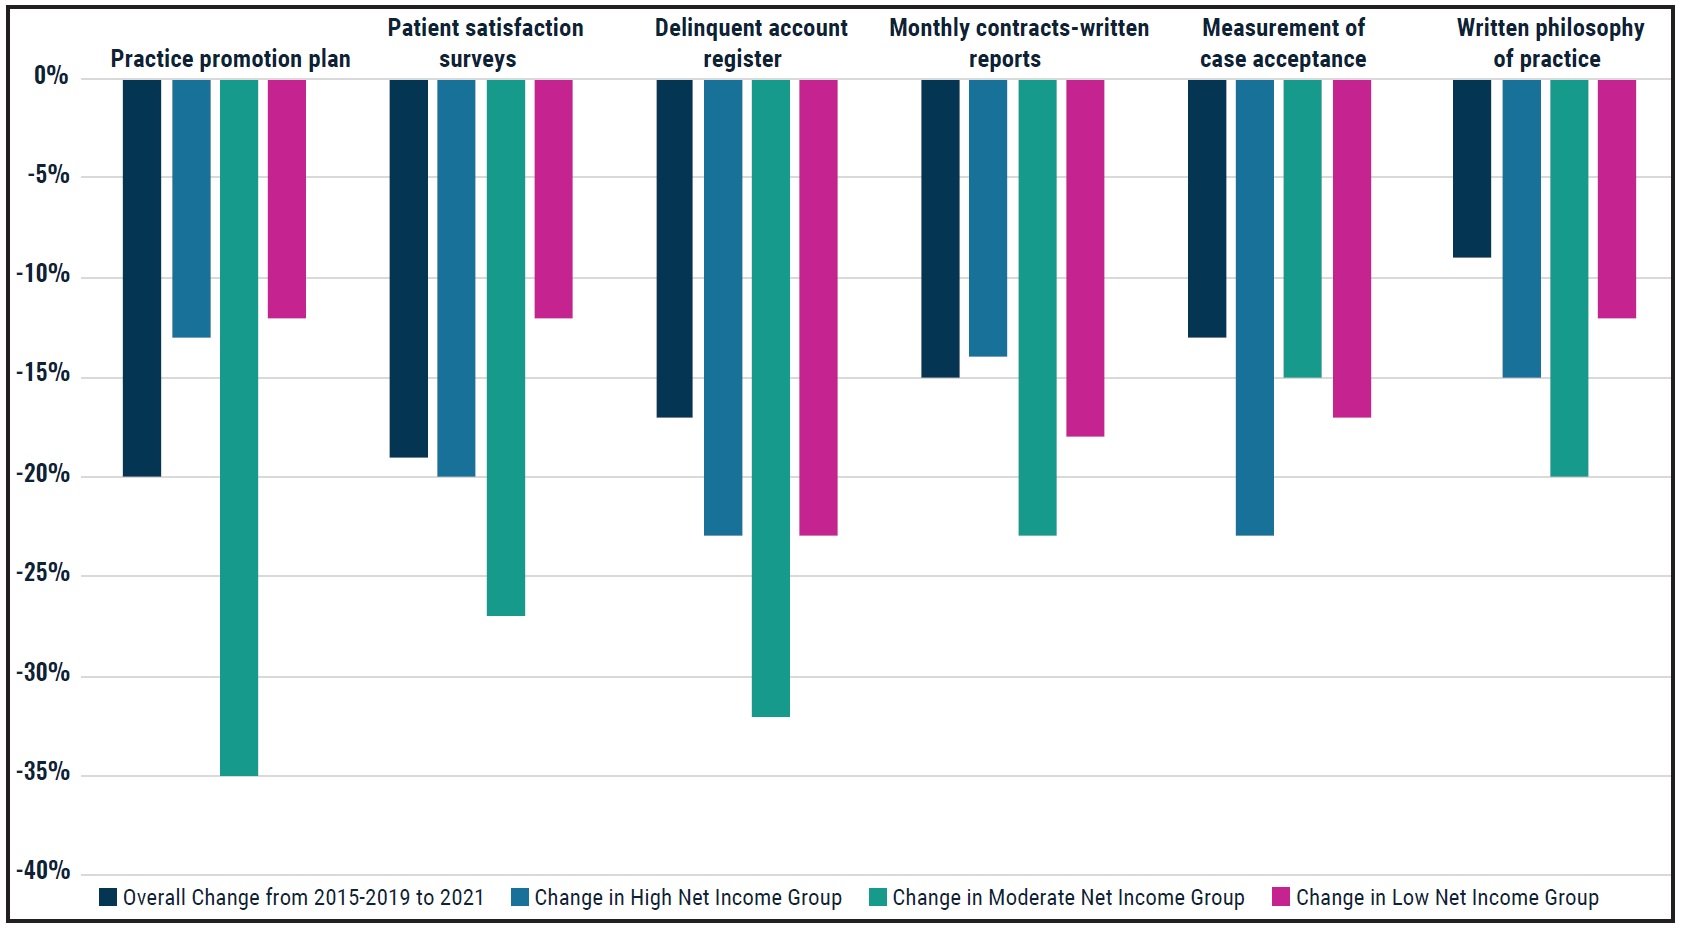
Fig. 5 Management methods showing at least 10% declines in usage between average of 2015, 2017, and 2019 Studies and 2021 Study in all three net income categories.
At least 10% declines were observed in both the moderate and low net income categories for written practice objectives, written practice plan, pretreatment flow control system, staff meetings, monthly accounts-receivable reports, and employee with primary responsibility as communications supervisor (Fig. 6).
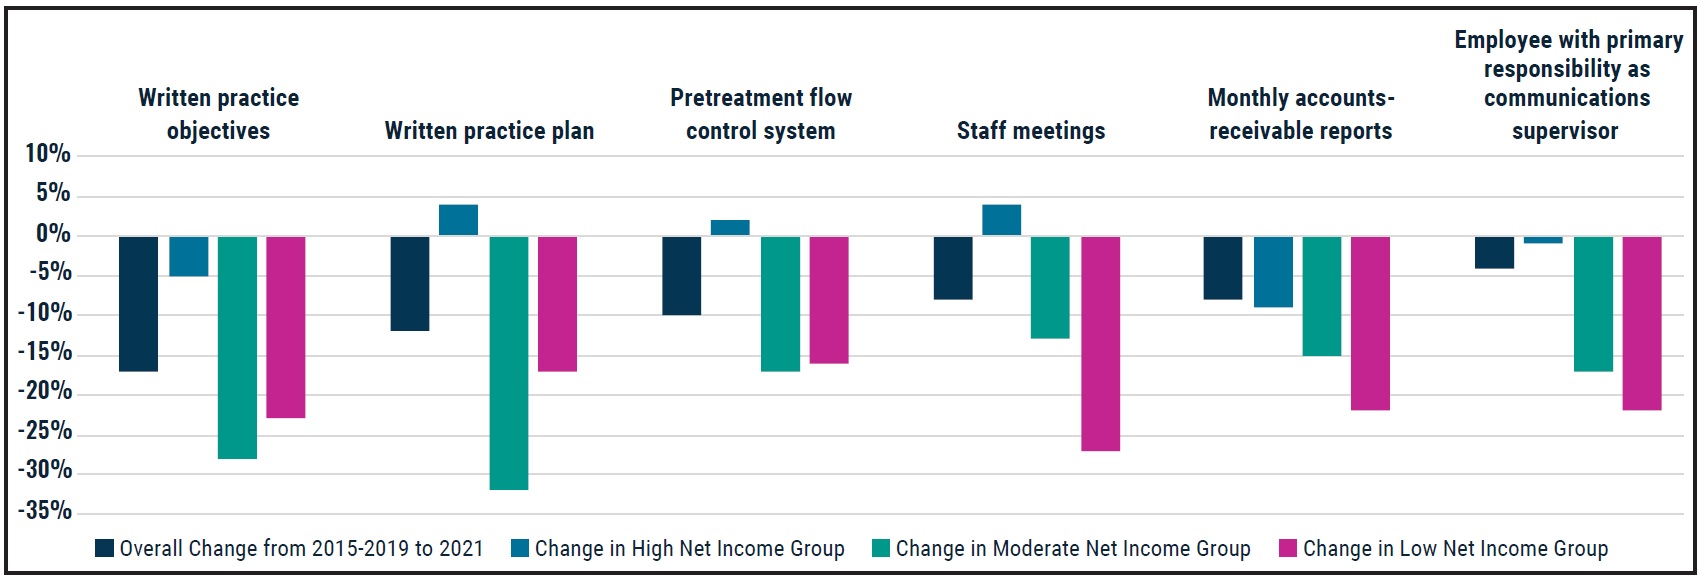
Fig. 6 Management methods showing at least 10% declines in usage between average of 2015, 2017, and 2019 Studies and 2021 Study in both moderate and low net income categories.
Only the moderate net income practices showed declines of at least 10% in usage of individual performance appraisals, written staff training program, post-treatment consultations, office procedure manual, dental management consultant, written practice budget, office policy manual, and measurement of staff productivity (Fig. 7).
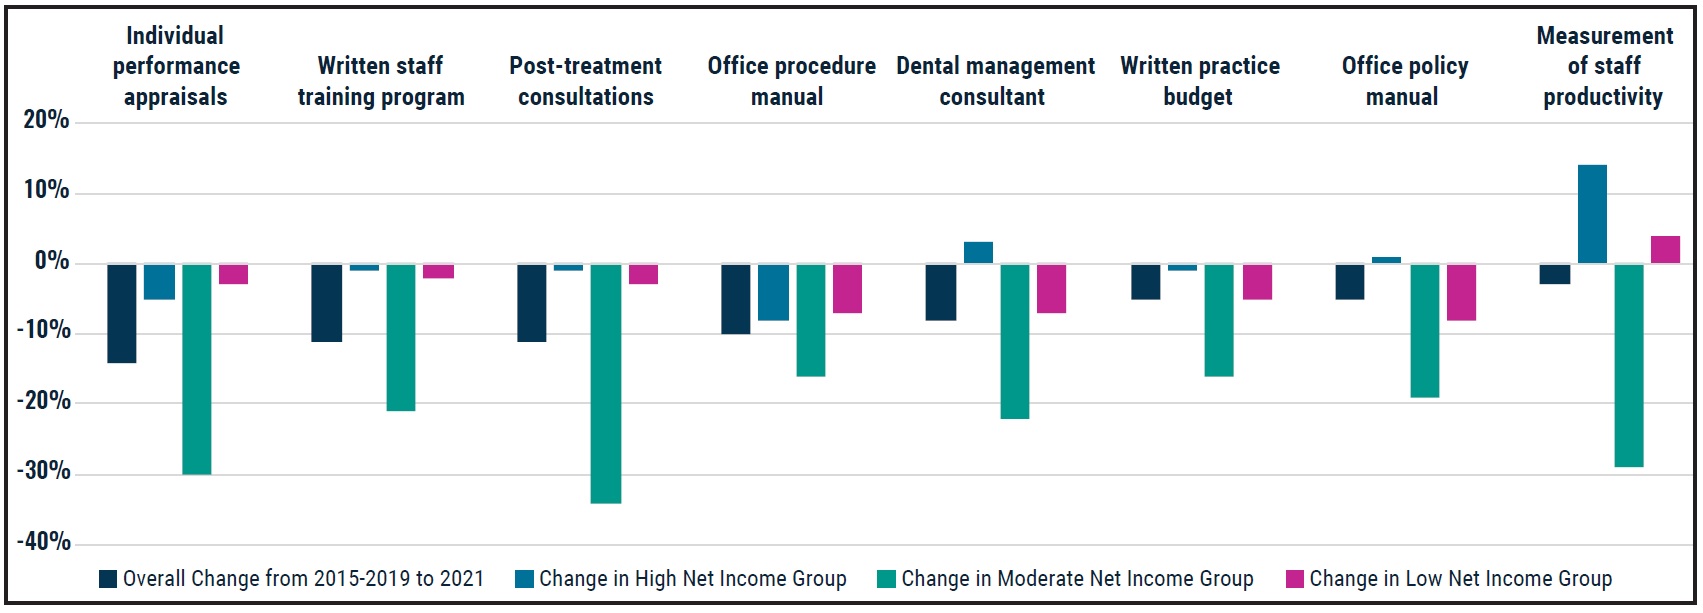
Fig. 7 Management methods showing at least 10% declines in usage between average of 2015, 2017, and 2019 Studies and 2021 Study in moderate net income category.
Both high and moderate net income groups had at least 10% declines in usage of written job descriptions, while only the high net income practices showed at least 10% declines in usage of cases beyond estimate report and in-depth analysis of practice activity; in addition, there was an overall decline of more than 10% in usage of treatment flow control system (Fig. 8).
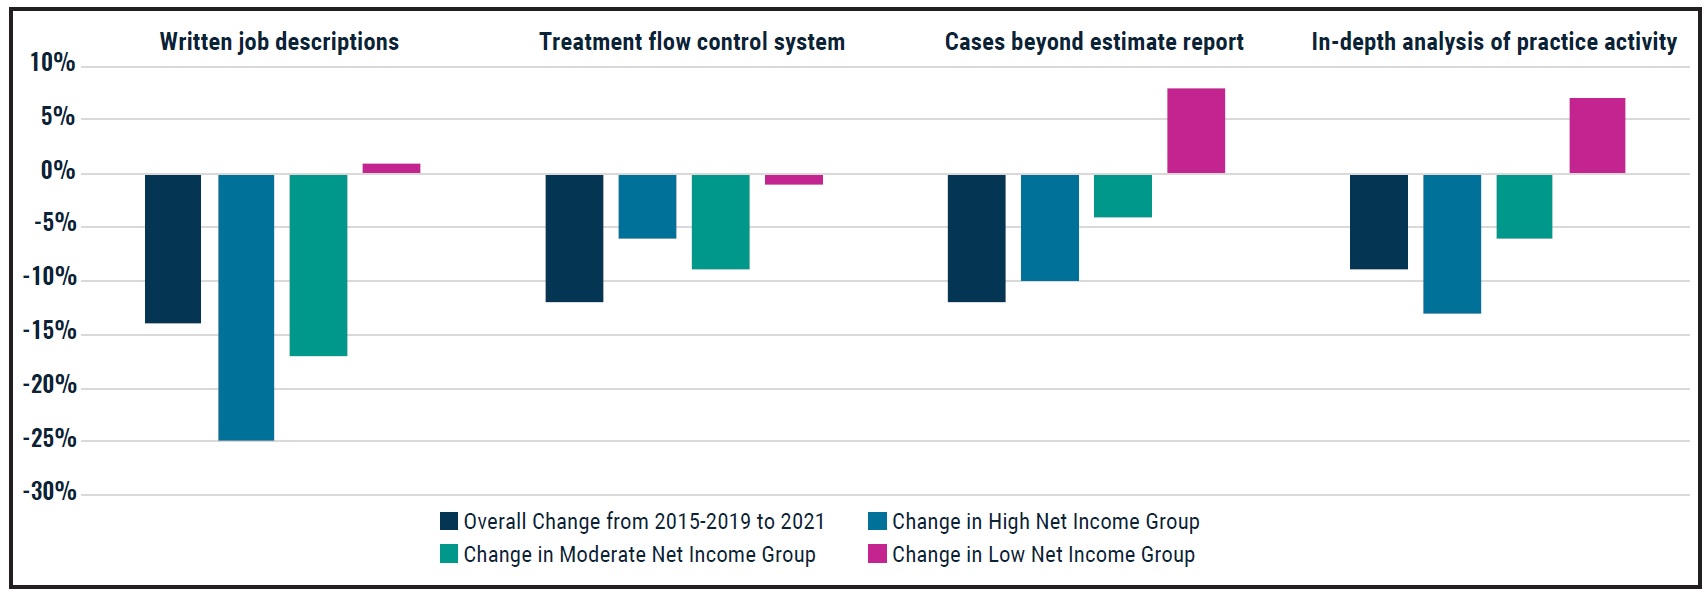
Fig. 8 Management methods showing at least 10% declines in usage between average of 2015, 2017, and 2019 Studies and 2021 Study in other net income categories.
Delegation
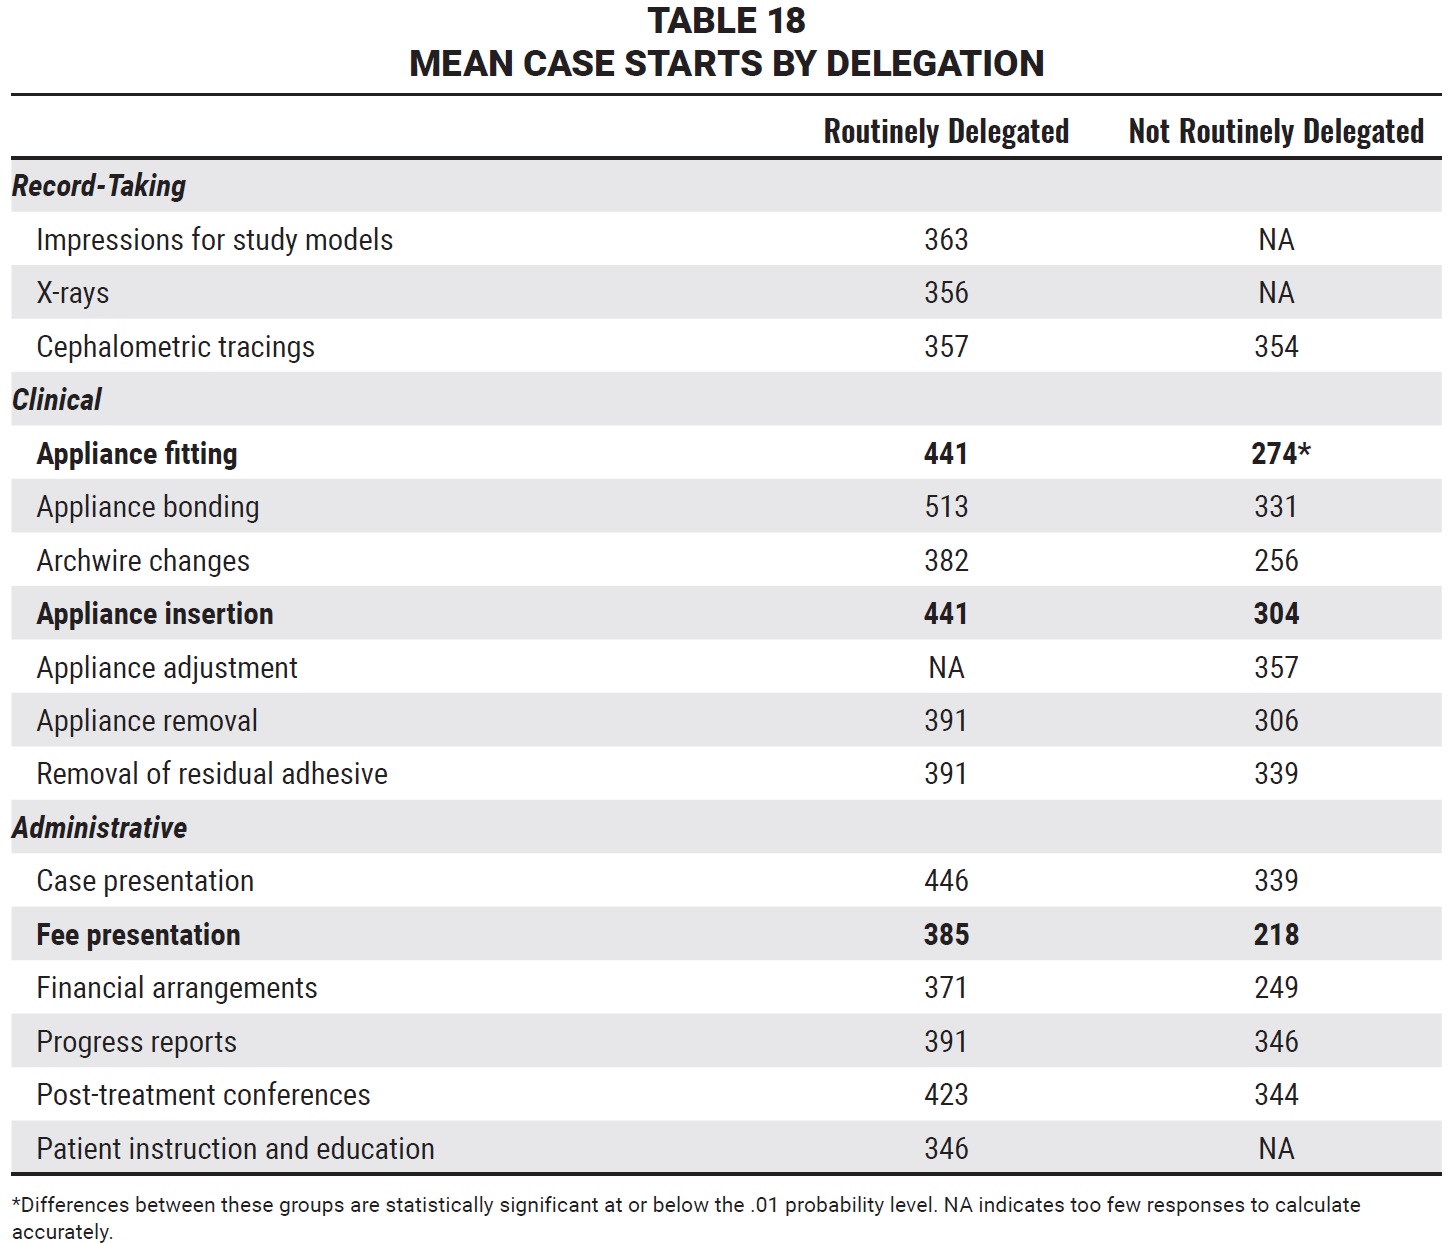
As in all previous Studies, routine delegation of virtually every task listed on the questionnaire (as opposed to occasionally or never delegating) was associated with a greater number of case starts (Table 18). Several tasks had too few respondents in one category or the other to allow accurate calculation. The differences in mean case starts were statistically significant for appliance fitting and noteworthy for appliance insertion and fee presentation.
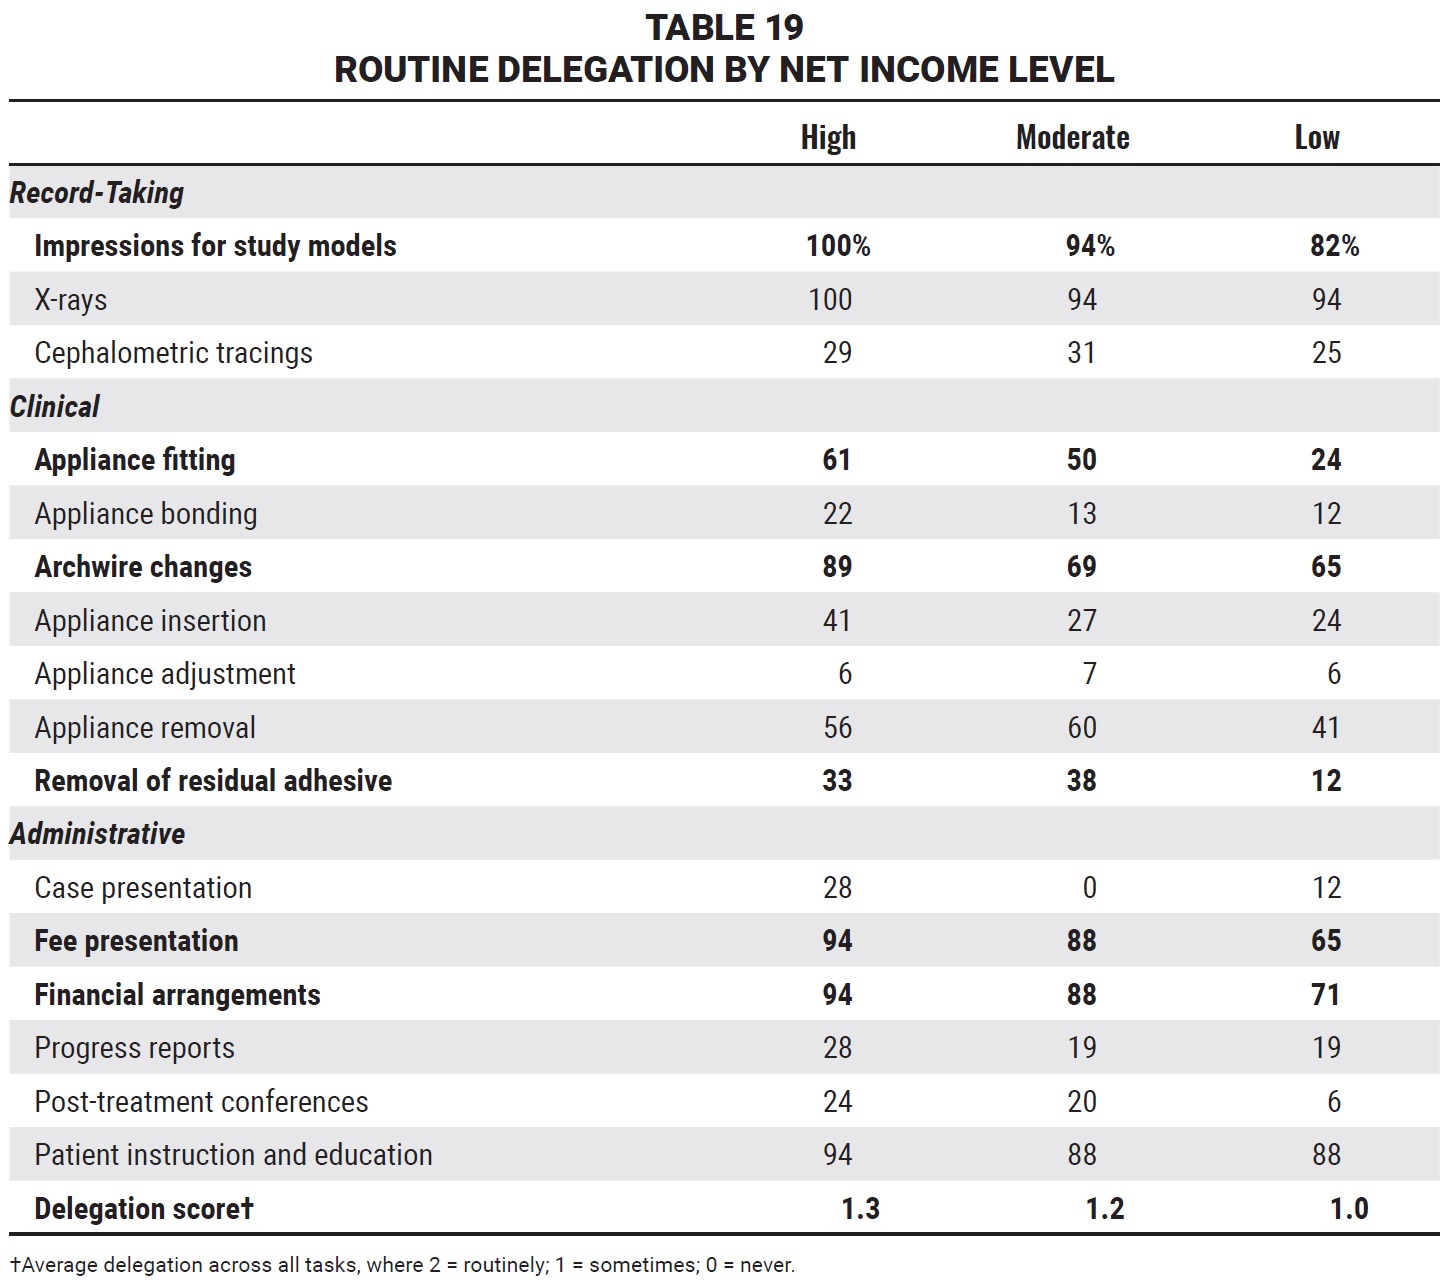
High net income practices were more likely than low net income practices to routinely delegate every task except appliance adjustment, which was a tie (Table 19). Although there were no statistically significant differences among the three net income categories, the differences were notable for the tasks of impressions for study models, appliance fitting, archwire changes, removal of residual adhesive, fee presentation, and financial arrangements. The “delegation score,” in which delegation is averaged for all tasks listed, confirmed the trend toward more routine delegation as net income increased, but the difference was not statistically significant.
Practice-Building Methods
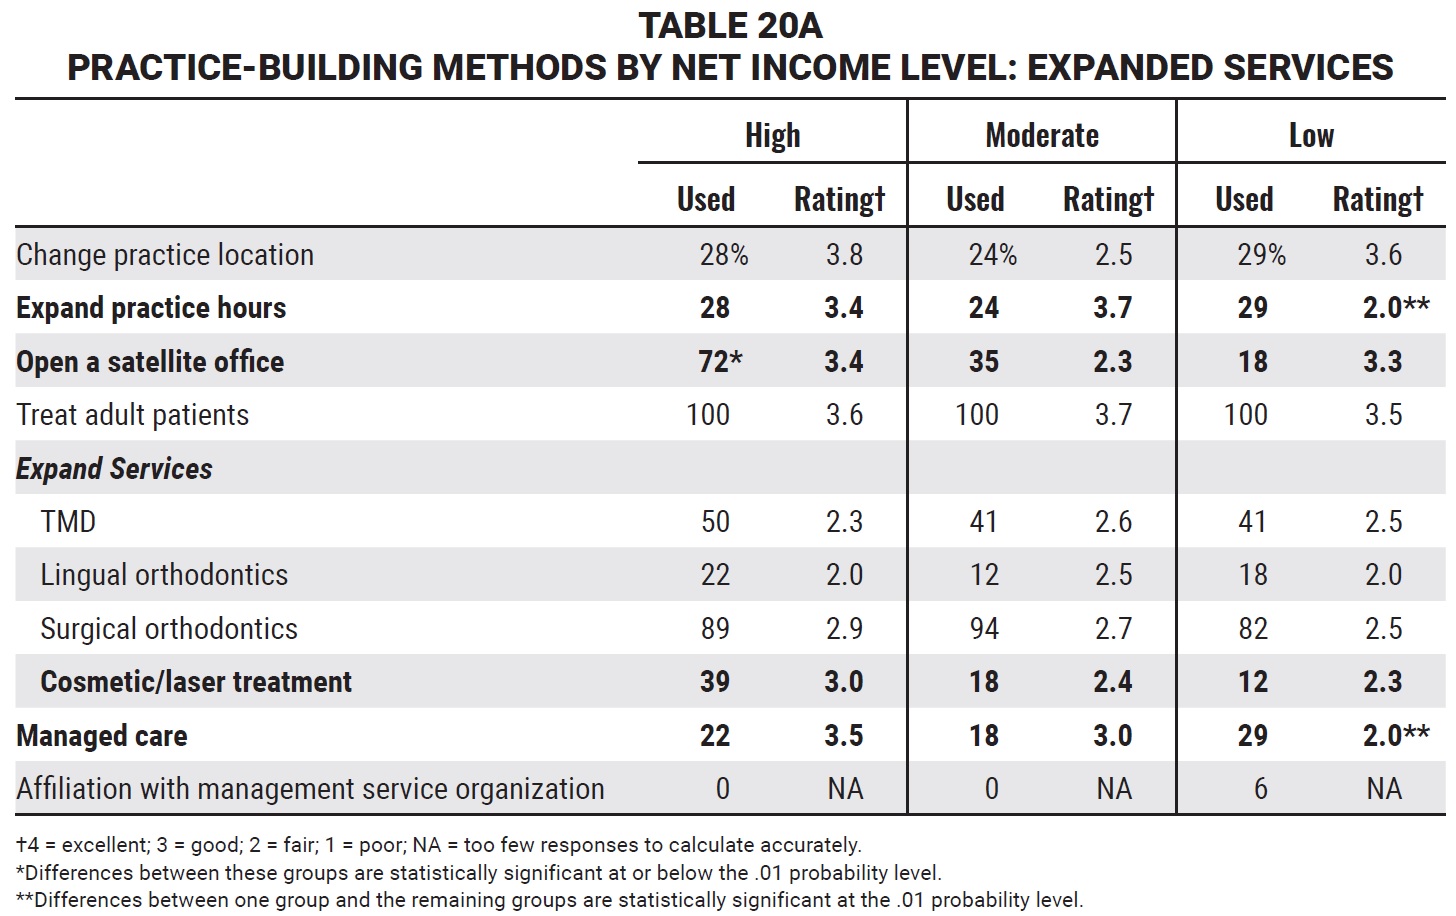
As in Part 1 and in the 2017 and 2019 Studies, the practice-building methods on the questionnaire were divided into categories. Among the expanded services, significant differences were found according to net income level for usage of satellite offices and effectiveness ratings of expanded practice hours and managed care (Table 20A). High net income respondents have historically reported more satellite offices and rated them highly; indeed, the number of office locations seems to give them an edge over moderate net income practices, considering that their numbers of consultations and case starts per office were almost identical (Fig. 3). Other services rated 3.0 (“good”) or higher by the high net income practices were changing practice location, treating adult patients, and cosmetic/laser treatment.
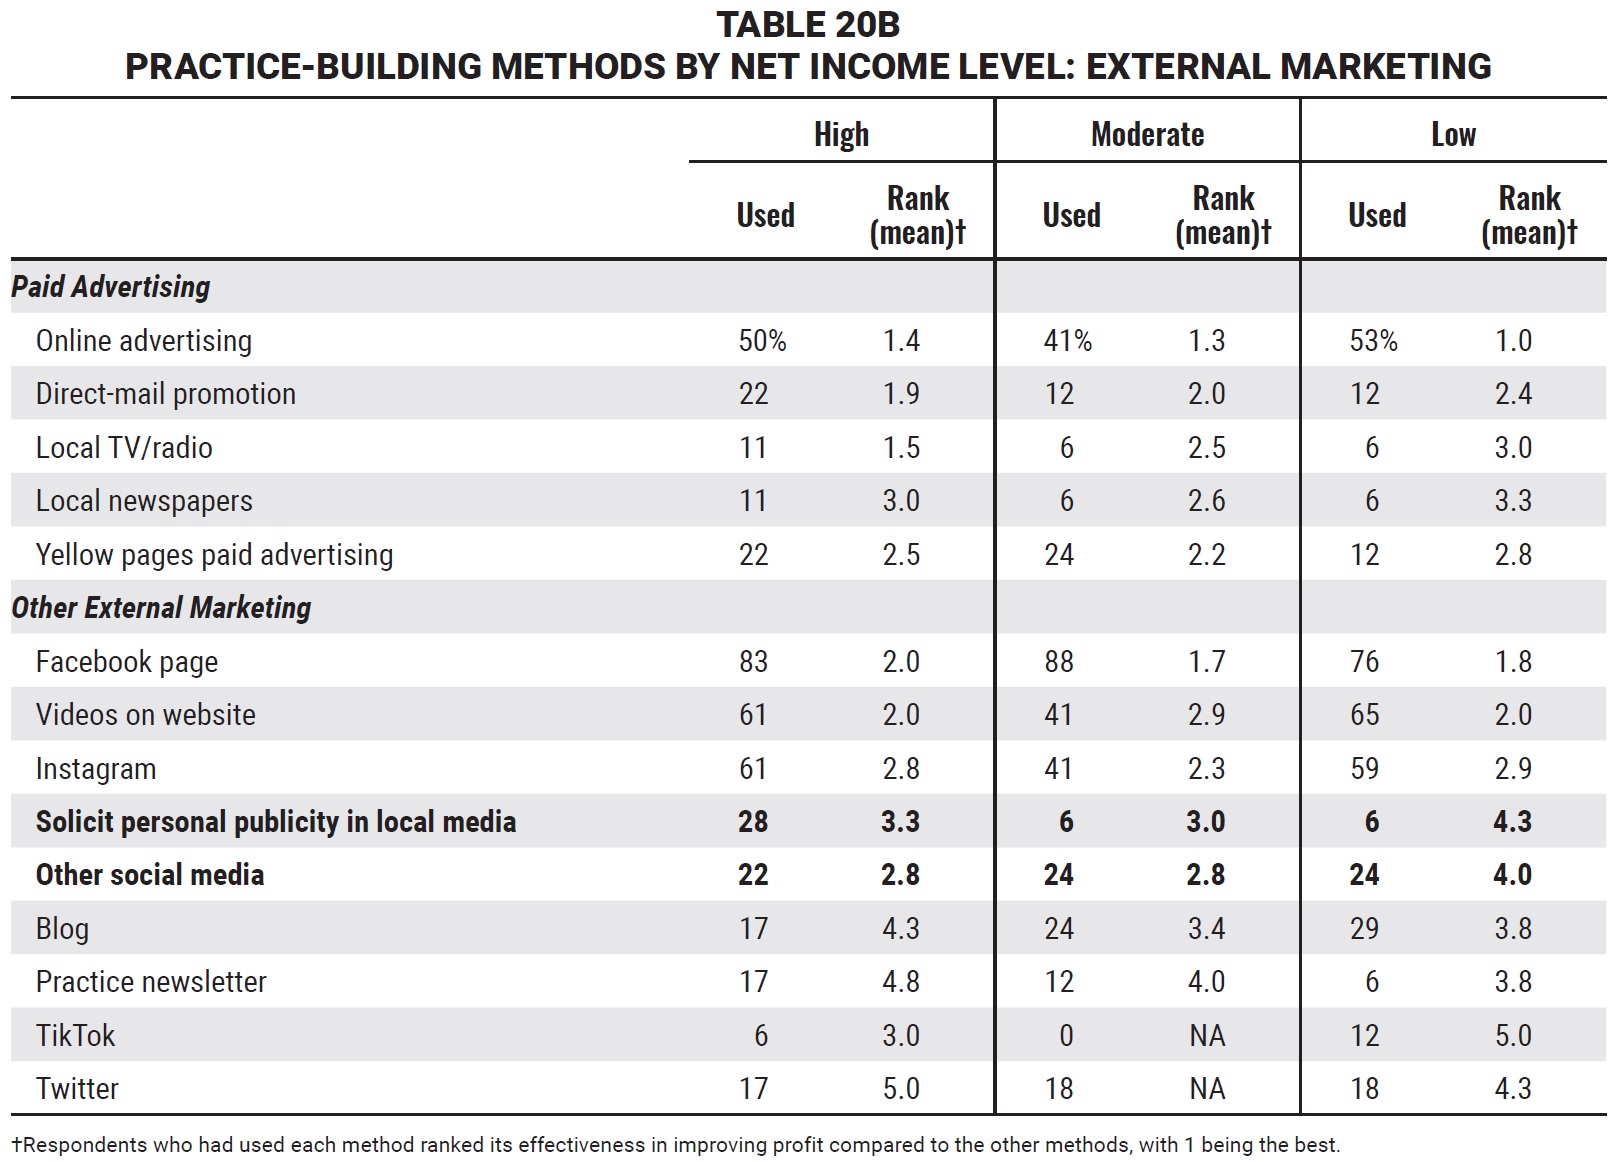
Although Facebook was the most used external marketing method, paid online advertising was rated more effective than social media in terms of profitability by all three net income groups (Table 20B). Methods ranked highest by the high net income respondents were online advertising, local TV or radio, direct-mail promotion, Facebook page, and website videos; methods ranked lowest by the same group were Twitter, practice newsletter, and practice blog.
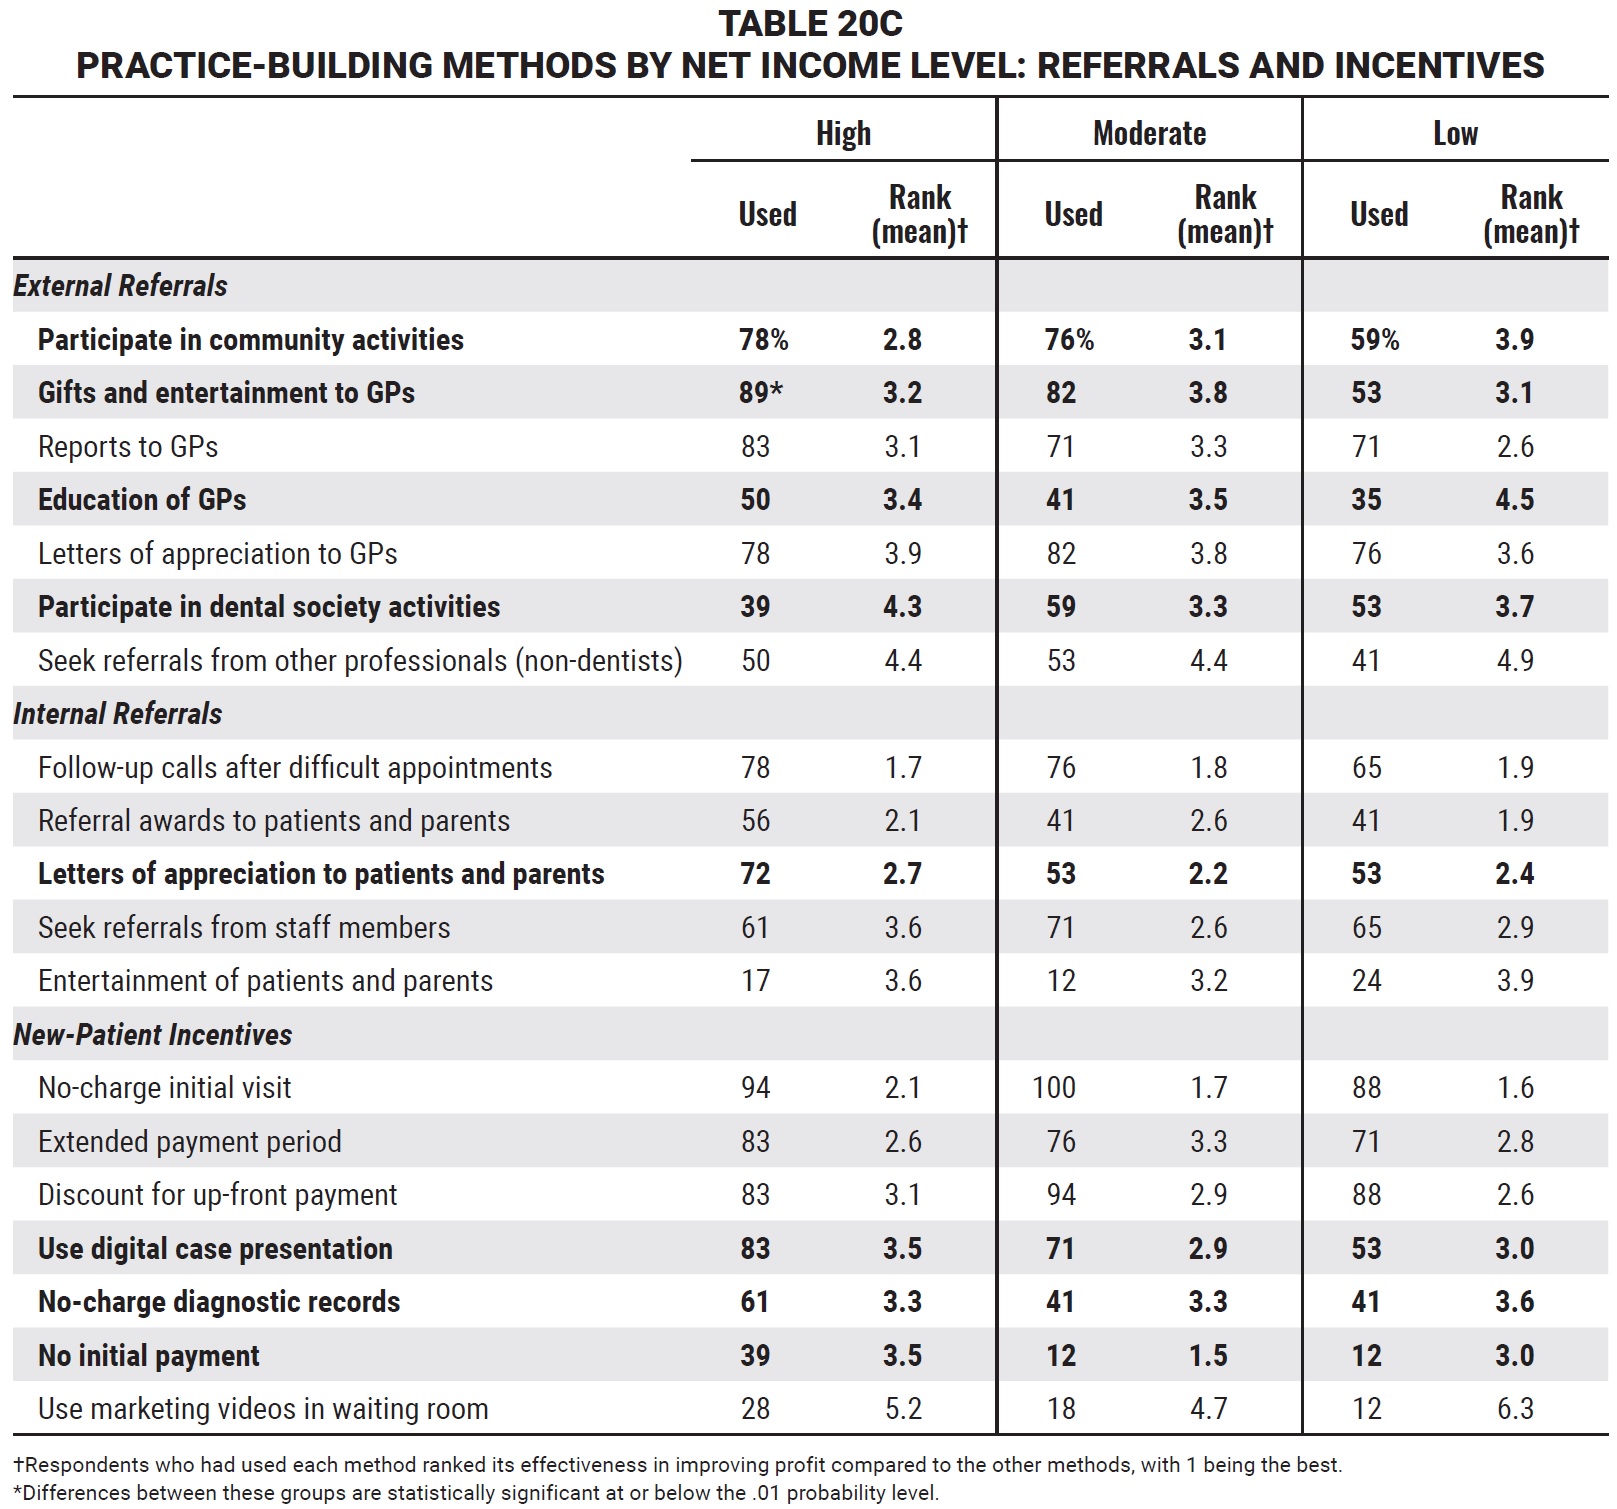
Among the methods aimed at referrals, the high net income respondents were significantly more likely than others to use gifts and entertainment to GPs and notably more likely to use participation in community activities, education of GPs, letters of appreciation to patients and parents, digital case presentation, no-charge diagnostic records, and no initial payment (Table 20C). On the other hand, the high net income practices were notably less likely to participate in dental society activities. Methods ranked as most effective by the high net income group were follow-up calls after difficult appointments, referral awards to patients and parents, no-charge initial visit, and extended payment period. Methods rated least effective by that group were marketing videos in the waiting room, seeking referrals from other professionals, and participation in dental society activities.
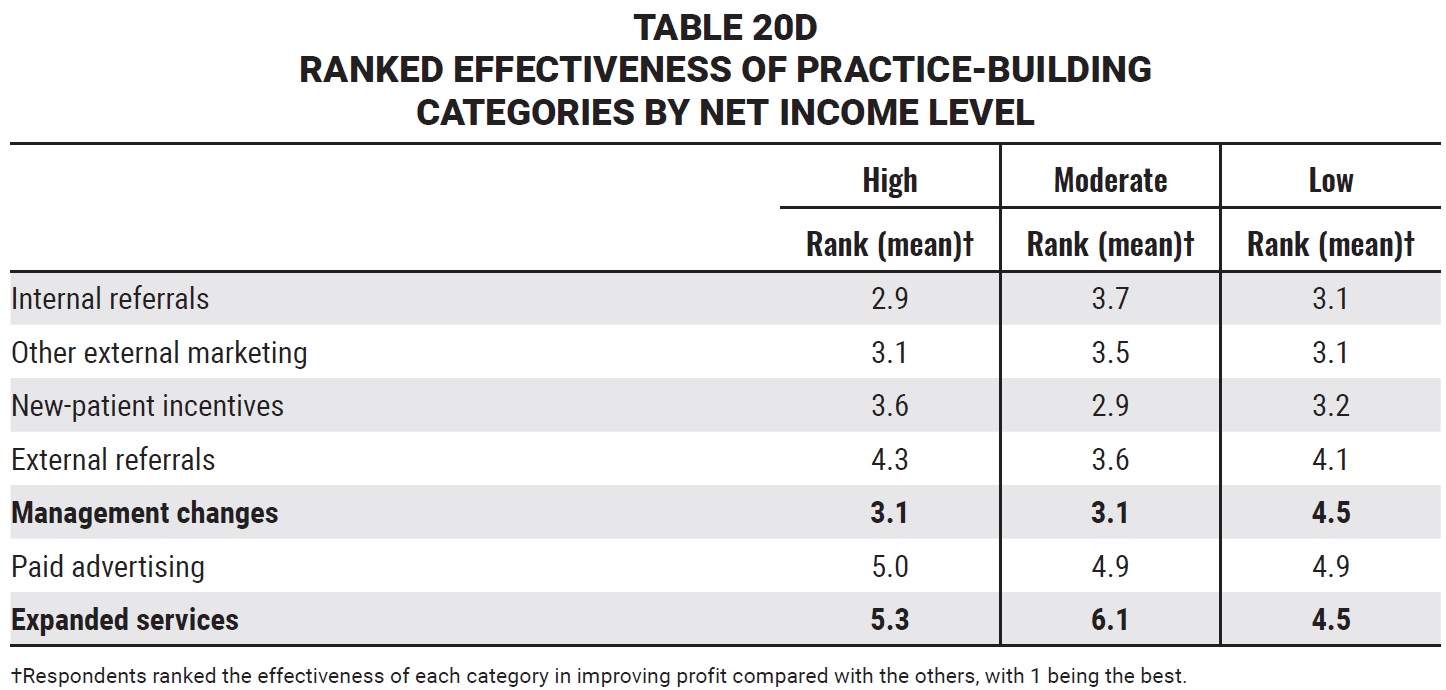
The questionnaire also asked respondents to rank the relative effectiveness of the practice-building categories in terms of improving profits. Internal referrals were considered the most effective category by the high net income practices; moderate net income practices ranked new-patient incentives as the most effective, and low net income practices ranked internal referrals and external marketing in a tie for first (Table 20D). Management changes were ranked much higher by the high and moderate net income groups than by the low net income group. Conversely, expanded services were rated as much more effective by the low net income practices, although they were still on the low end of the scale.
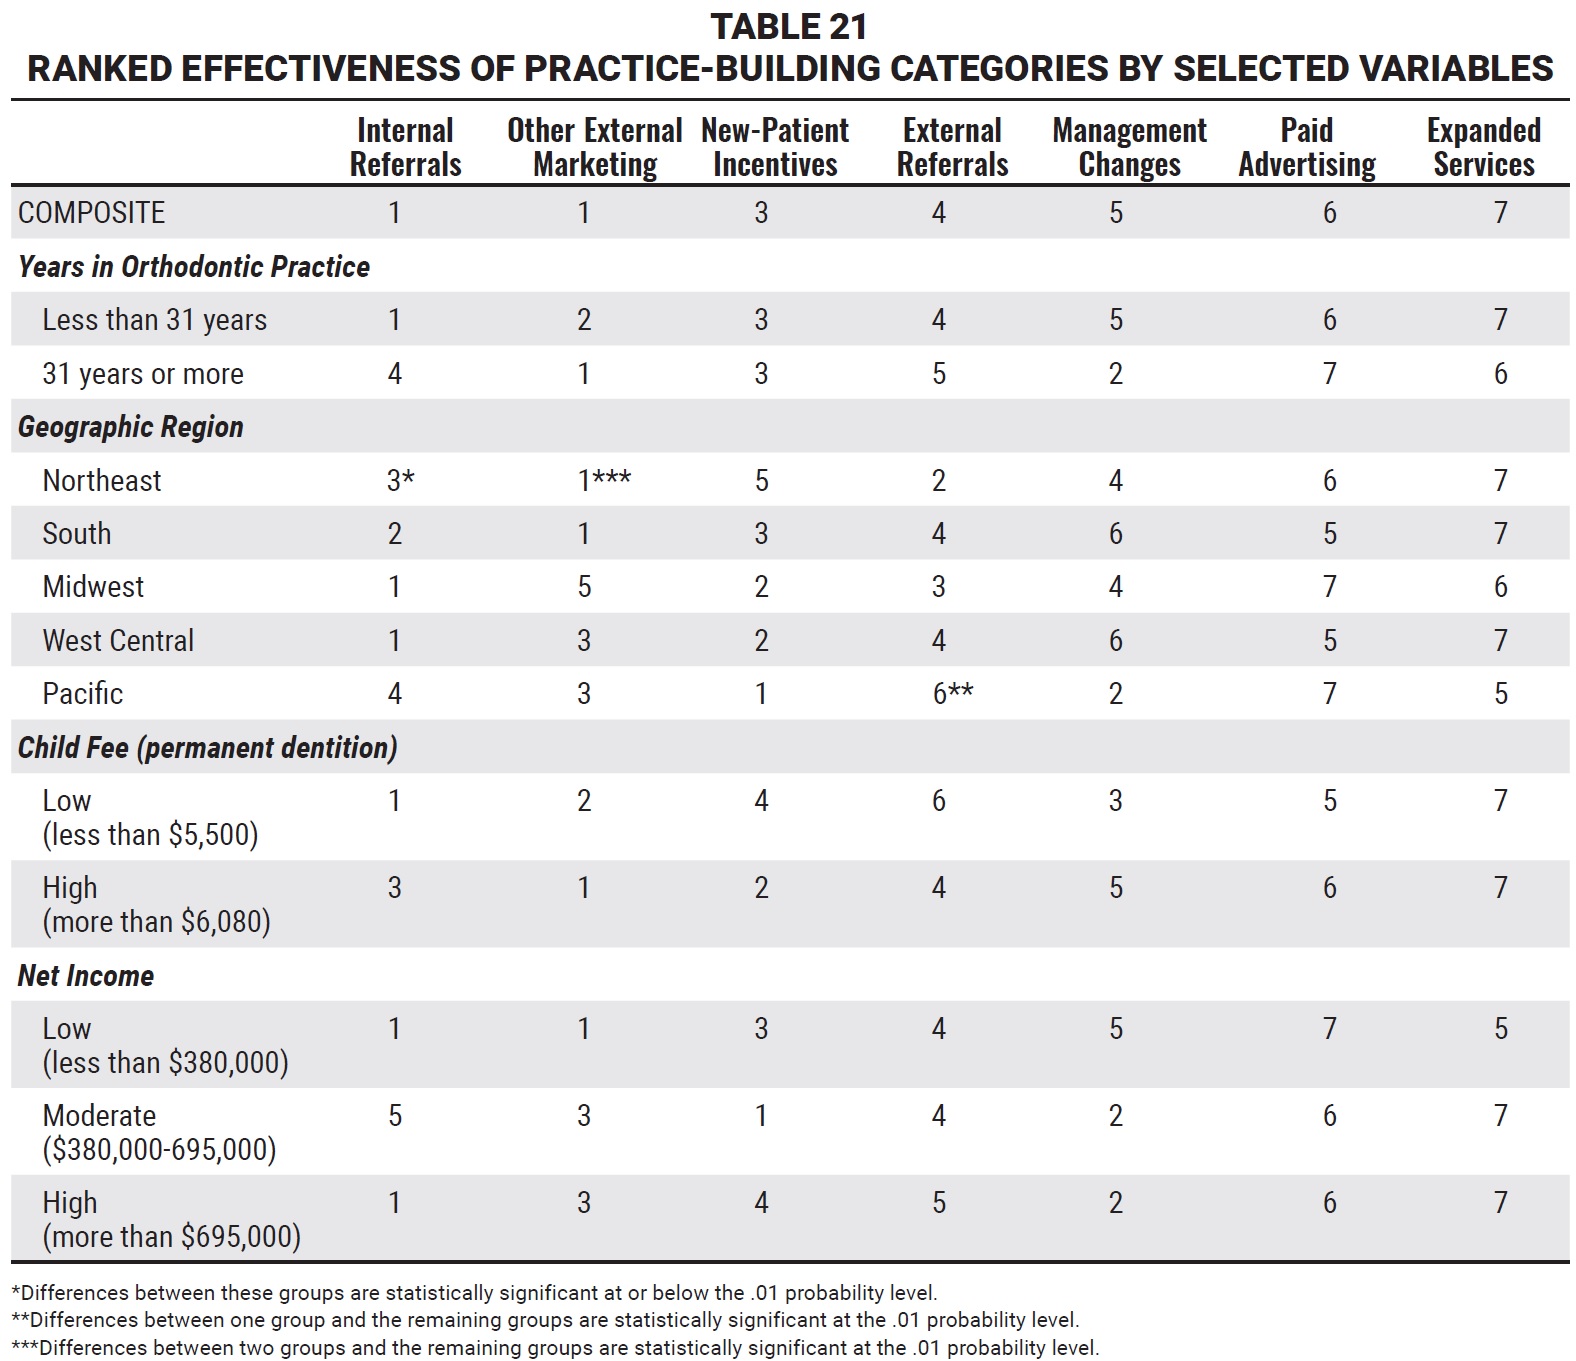
Some other salient differences were found in the ranked effectiveness of practice-building categories according to selected variables (Table 21). Respondents who had been in practice for 2-30 years ranked internal referrals highest and expanded services lowest, while those in practice for 31 or more years ranked other external marketing highest and paid advertising lowest. There were significant geographic differences in the rankings of internal referrals (No. 1 in the Midwest and West Central, No. 4 in the Pacific), other external marketing (No. 1 in the Northeast and South, No. 5 in the Midwest), and external referrals (No. 2 in the Northeast, No. 6 in the Pacific). Respondents who charged higher case fees ranked other external marketing methods highest and new-patient incentives second, whereas those who charged lower fees ranked internal referrals first and other external marketing second. Expanded services ranked last in both fee categories.
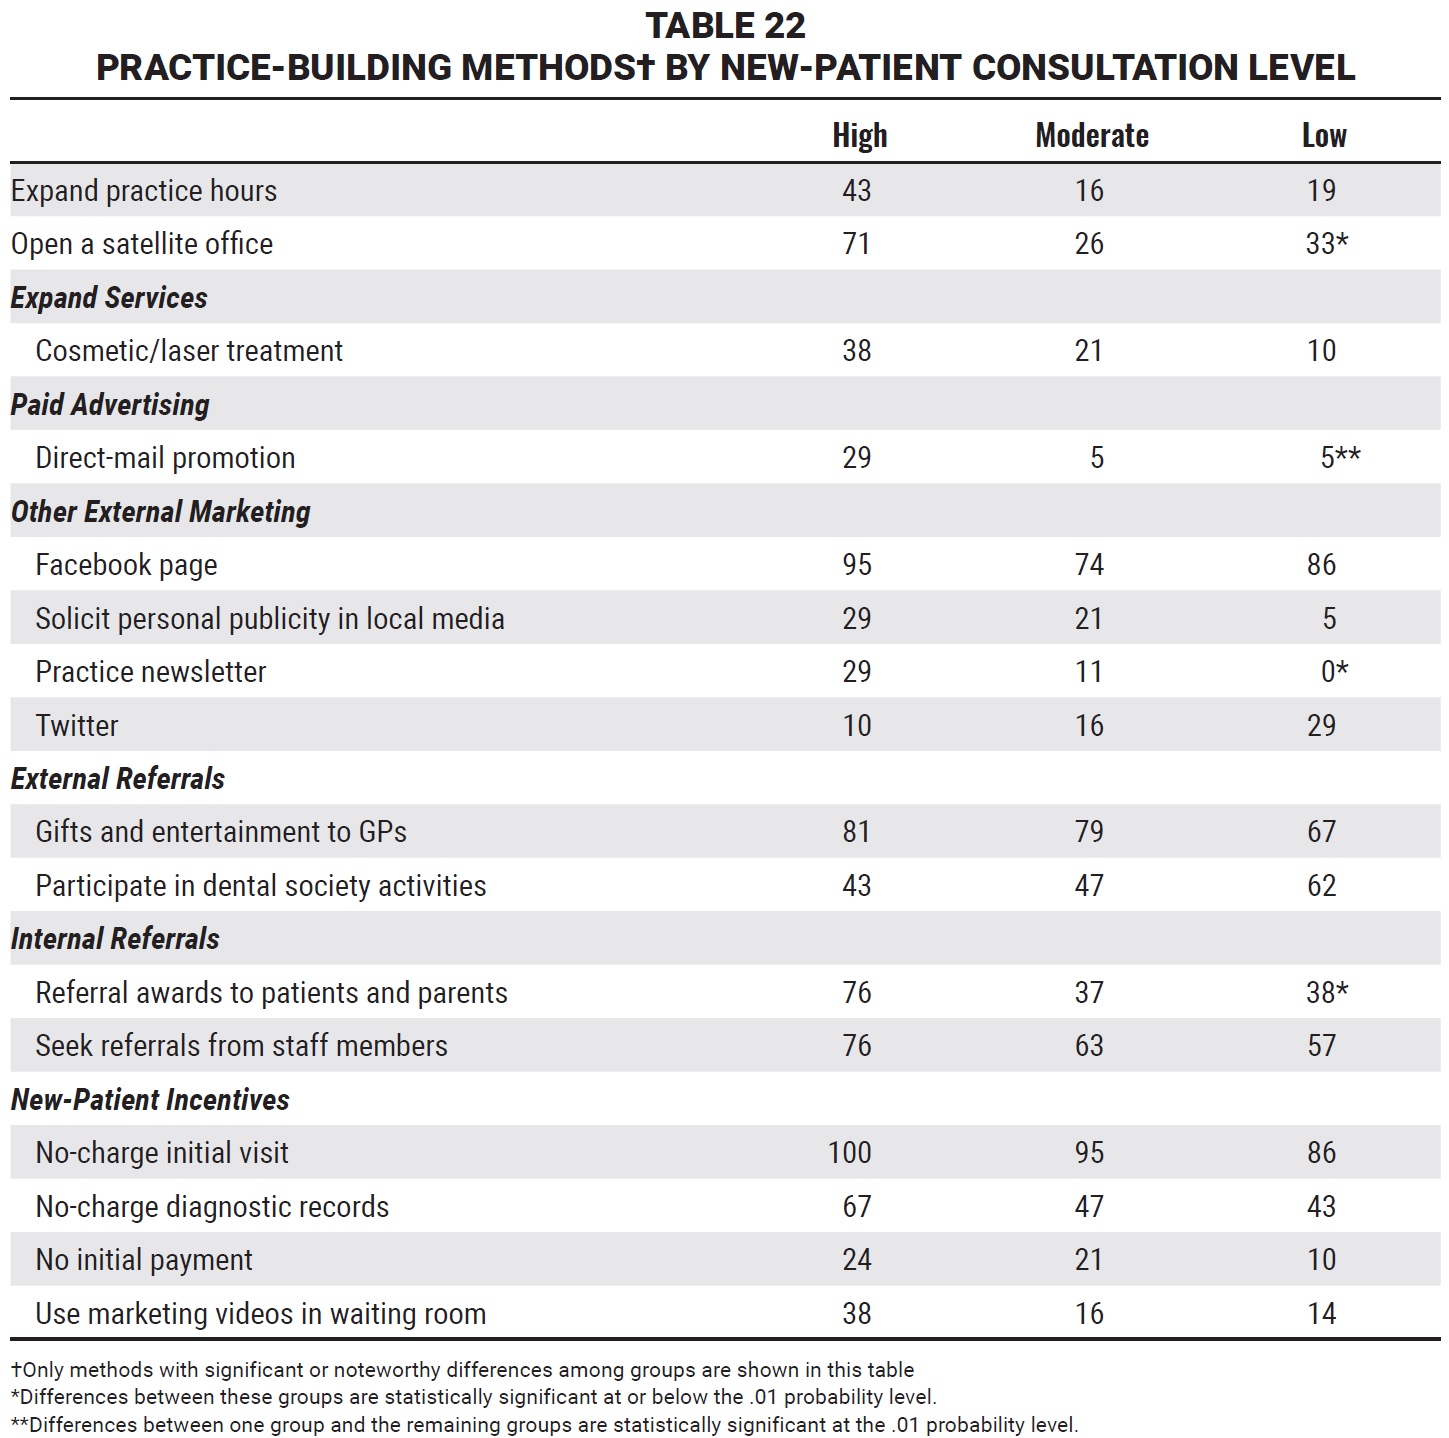
Generation of new patients might be the purest expression of the effectiveness of practice-building methods. When respondents were divided into three groups based on numbers of 2020 new-patient consultations (high = more than 595, moderate = 290-595, low = less than 290), there were striking differences in their employment of certain methods (Table 22). Practices with a high level of consultations were significantly more likely than others to use satellite offices, direct-mail promotion, practice newsletter, and referral awards to patients and parents. In addition, they were notably more likely to use expanded practice hours, cosmetic/laser treatment, Facebook page, personal publicity in local media, gifts and entertainment to GPs, referrals from staff members, no-charge initial visit, no-charge diagnostic records, no initial payment, and marketing videos in the waiting room. Respondents with a low level of consultations were notably more likely than others to use Twitter and to participate in dental society activities.
(TO BE CONTINUED)






COMMENTS
.