A Computerized Tooth-Width Analysis
Tooth-width ratios are used diagnostically to quantify the harmony between the mandibular and maxillary arches. A number of analyses have been developed to compare the tooth-width ratios of malocclusions to standardized norms.1-4 The Ho-Freer Graphical Analysis of Tooth-Width Discrepancy (GATWD) provides a simple graphic description of tooth-width relationships between the arches, a comprehensive representation of tooth-width ratios in various arch segments, and a method of localizing tooth-width discrepancies.5,6
Although the GATWD is more comprehensive than previous analyses, it is also more labor intensive. Now, a personal-computer-based version of the GATWD enables clinicians to incorporate the analysis into their routine diagnosis and treatment planning, as well as to identify tooth-size mismatches that may develop toward the end of treatment.
Program Development
To generate baseline data, tooth-width measurements were obtained from a sample of pretreatment orthodontic study casts. Nine cumulative percentage ratios relating maxillary teeth to mandibular teeth were derived5 (Table 1), and a template was created to show ranges of two standard deviations from the means (Fig. 1).
Similar articles from the archive:
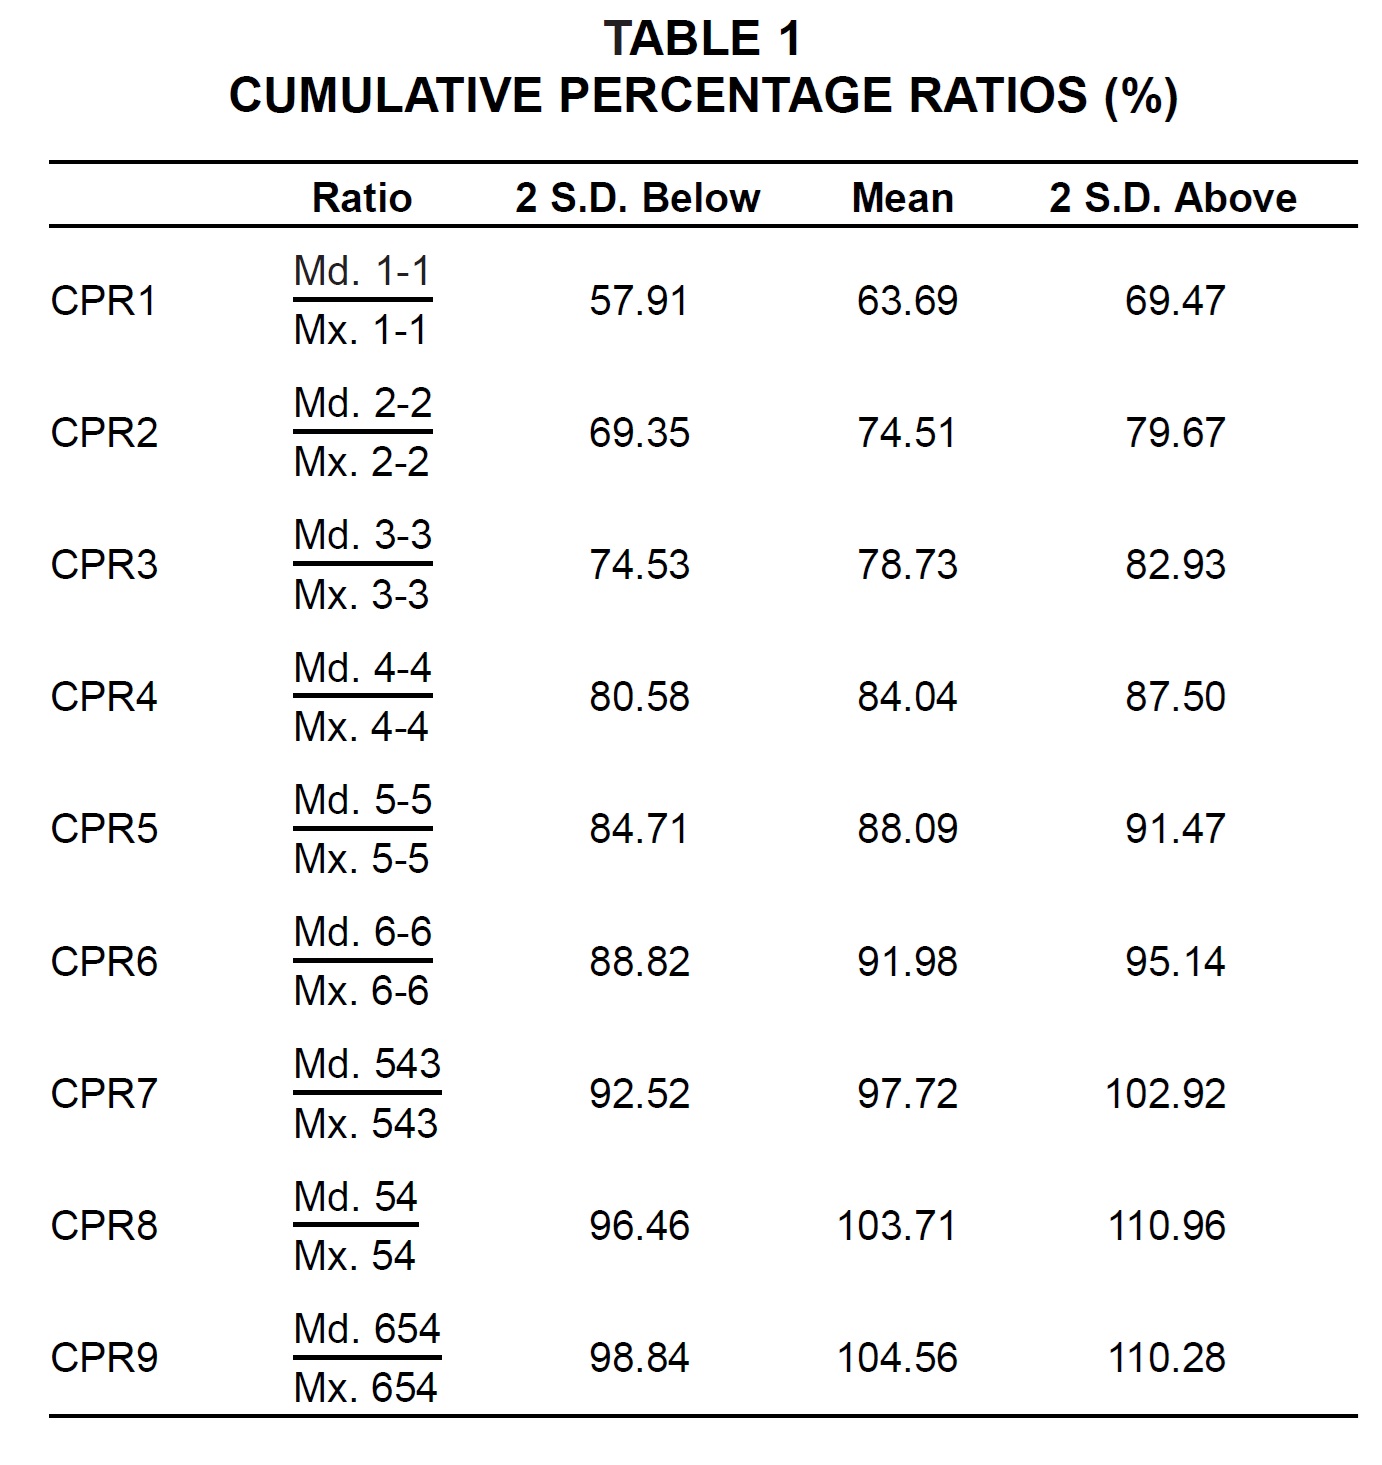
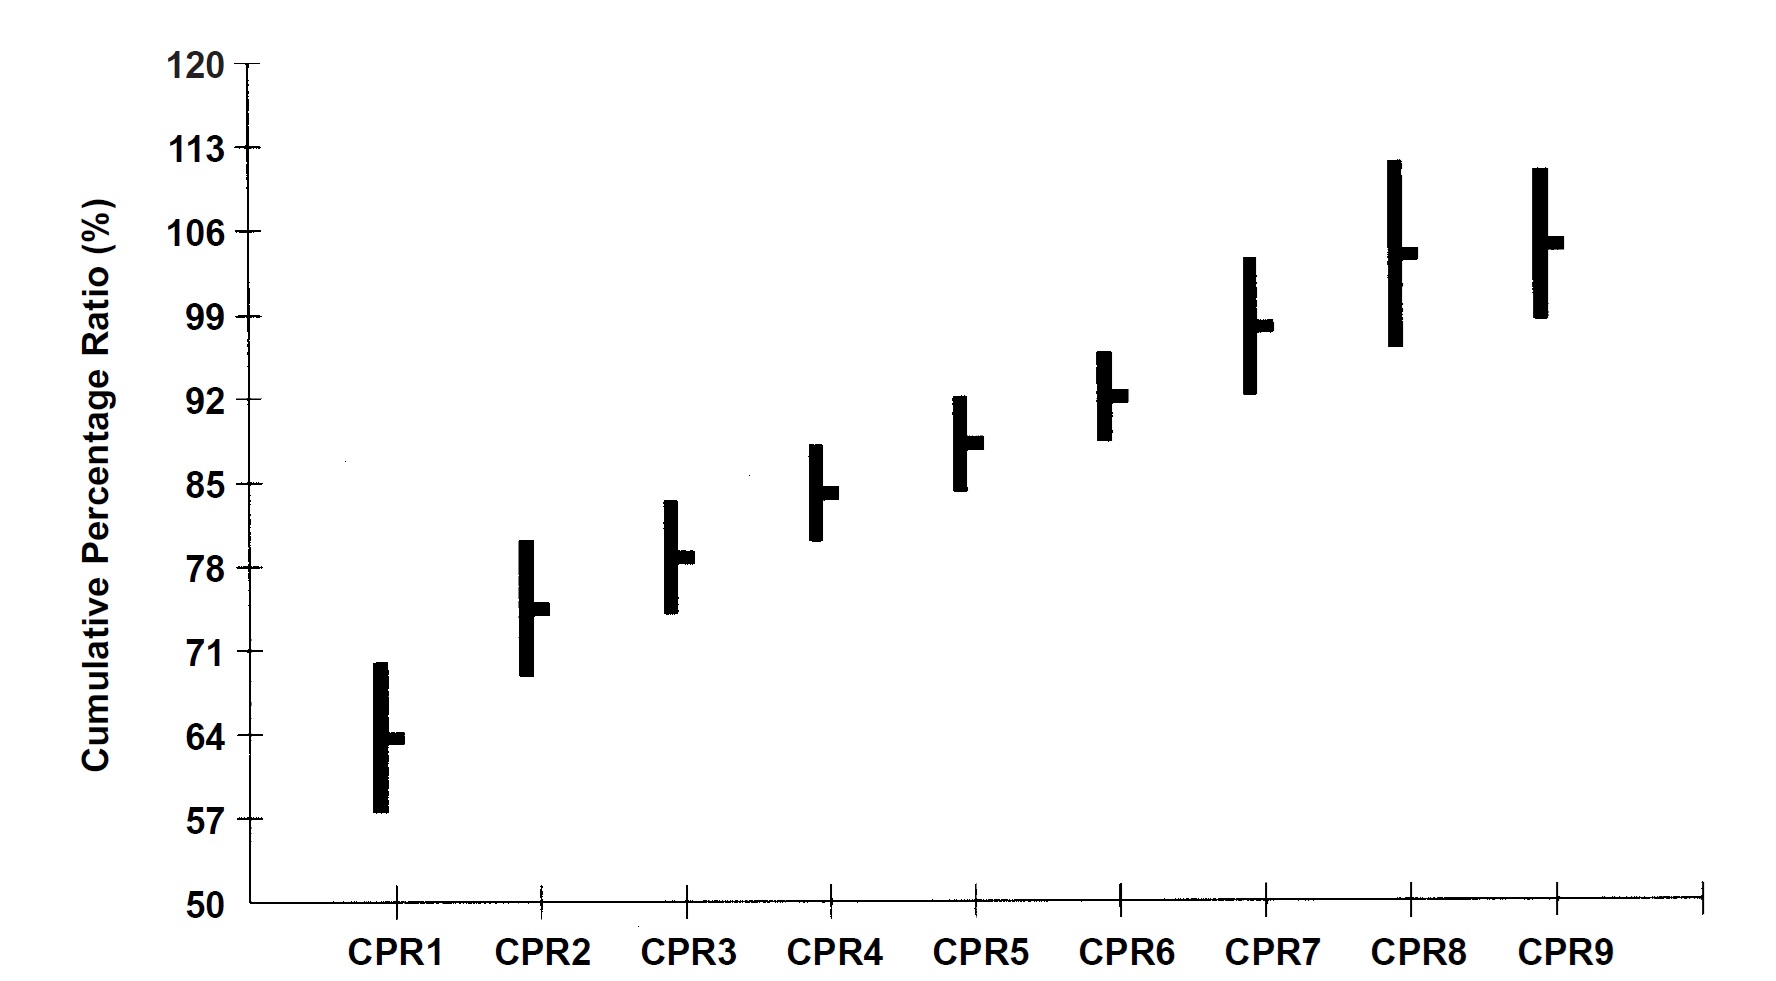
Fig. 1 Template showing mean mandibular-to-maxillary cumulative percentage ratios (Table 1), plus or minus two standard deviations.
A software engineer was hired to design a computer version of the GATWD* that permits direct input of 24 tooth-width measurements per patient from study casts, using digital calipers, or manual input via the computer keyboard. The program, developed using Microsoft Visual Basic 3.0 for Windows**, provides a quick calculation of tooth-width ratios and tooth-width excesses. In addition, it incorporates the template of mean tooth-width ratios for comparison of any malocclusion with the mean values. Reports such as tooth-width ratios and tooth-width excesses and a graphic display of the analysis can be printed with the Windows Print Manager, and the hard copies can then be placed in the patient's treatment folder.
Program Use
The beaks of a Mitutoyo*** 6"/150mm Digital Caliper Zero Set (Fig. 2) are ground down to tapered points to allow precise positioning on the mesial and distal contact points of the teeth. The digital calipers are connected to a Mitutoyo Digimatic Mini Processor (Model No. DP-1HS) via a Mitutoyo Digimatic cable. An RS-232C interface cable links the Mini Processor to an IBM-compatible personal computer.
The program has five main screens:
Patient details screen (Fig. 3): Basic patient information is entered here. The malocclusion line has a pull-down menu with choices of Class I; Class II, division 1; Class II, division 2; Class II indefinite; and Class III. A field is available to indicate extraction or nonextraction treatment. Pull-down extraction codes include four first bicuspids; maxillary first and mandibular second bicuspids; maxillary first bicuspids alone; four second bicuspids; and maxillary second and mandibular first bicuspids. Other extraction patterns can be entered by typing in the ISO/FDI tooth numbers. The patient information can be used to generate overview reports on the practice's entire patient population.
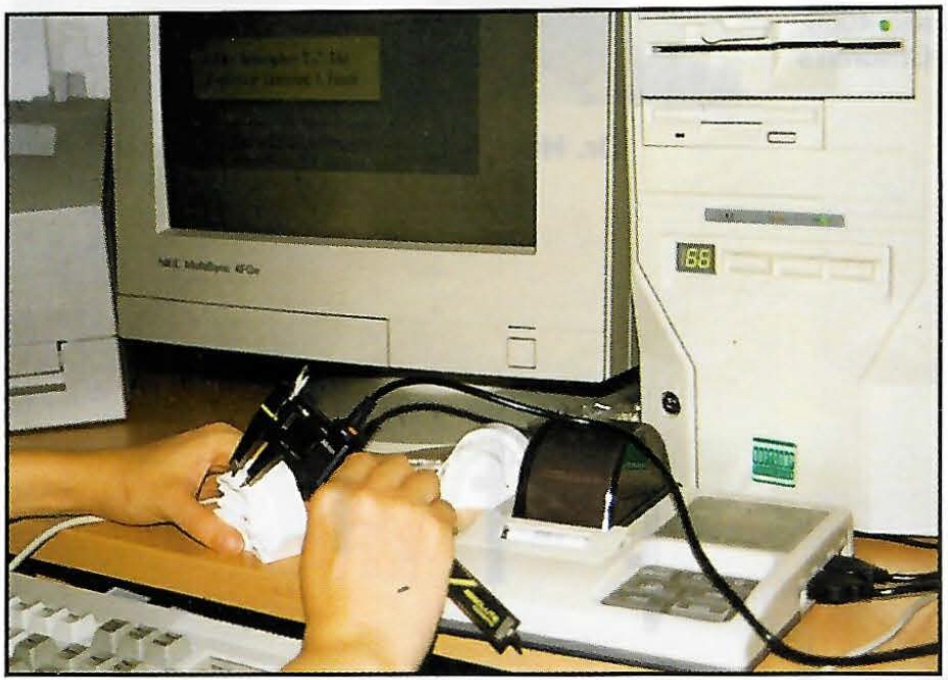
Fig. 2 Digital calipers connected to computer via Mitutoyo Digimatic Mini Processor.
Fig. 3 Patient details screen.
Mesiodistal tooth-width measurement screen (Fig. 4): Measurements of the 24 permanent teeth from first molar to first molar are input directly into the appropriate fields by pressing the data key on the digital calipers. Editing is possible by deleting the incorrect entry and manually entering the tooth width.
Tooth-width ratio screen (Fig. 5): When the "Derived Ratios" button is activated (Fig. 4), the program performs the calculation of tooth-width ratios. Tooth-width excess can then be viewed tooth by tooth or in graphic form.
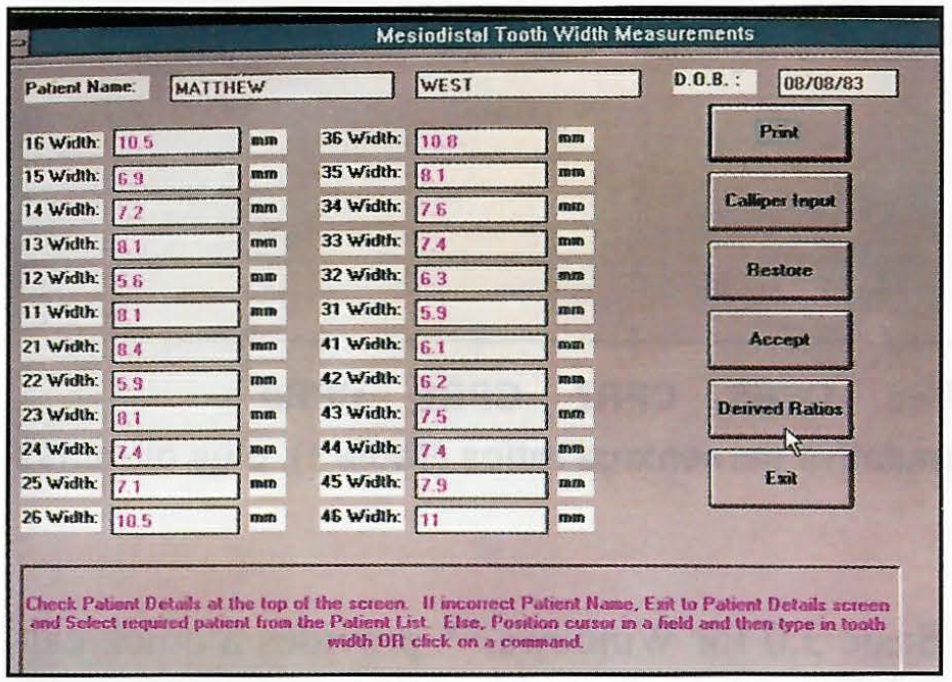
Fig. 4 Mesiodistal tooth-width measurement screen, allowing direct input from digital calipers.
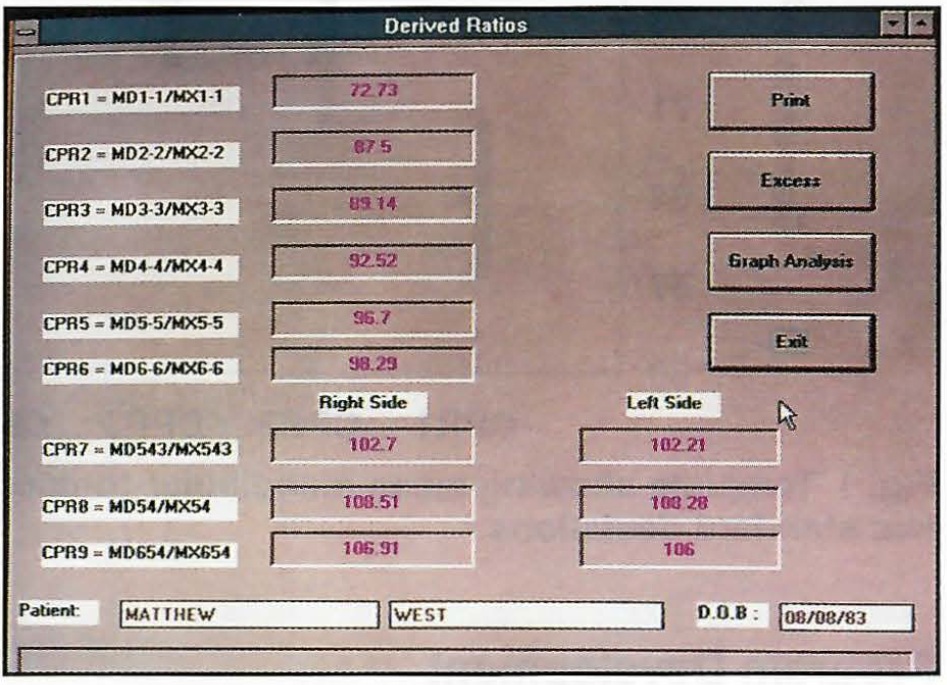
Fig. 5 Tooth-width ratio screen.
Tooth-width excess screen (Fig. 6): The amount of tooth-width excess is displayed for each tooth. Graphic display of tooth-width analysis screen (Fig. 7): The graphic display, based on the template shown in Figure 1, provides an immediate visual assessment of any incompatible maxillary-to-mandibular tooth widths. Tooth-width ratios greater than two standard deviations above or below the mean are readily recognizable.
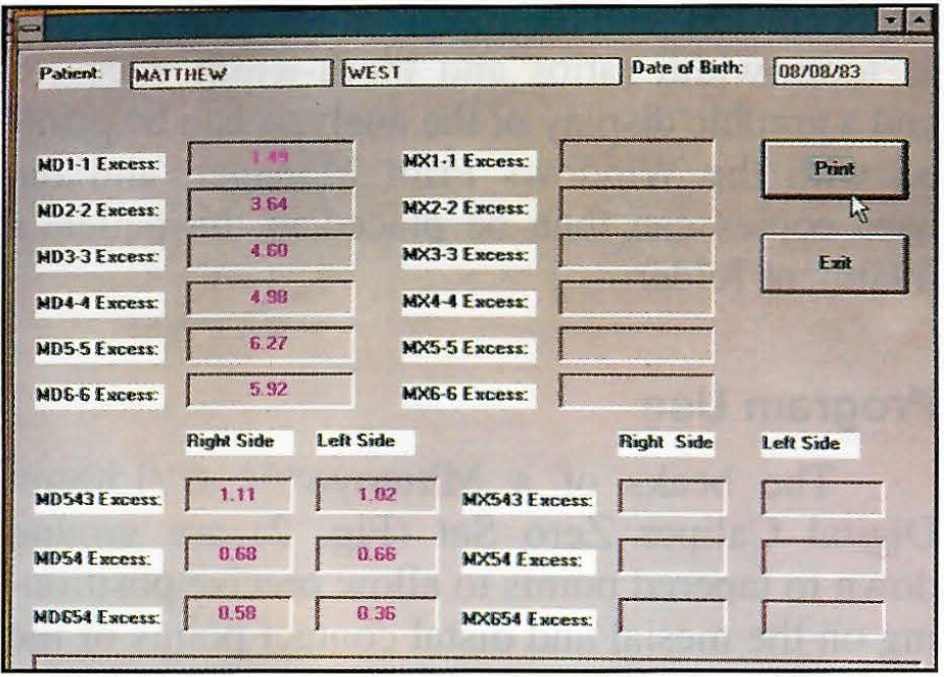
Fig. 6 Tooth-width excess screen.
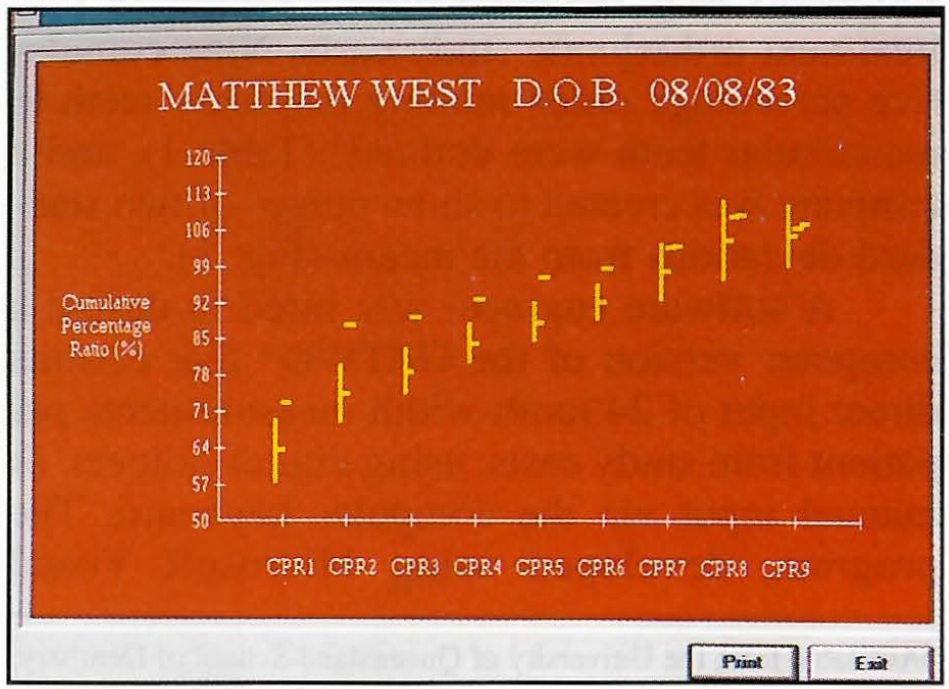
Fig. 7 Graphic display of tooth-width analysis screen, comparing patient's tooth-width ratios to standard template.
In the Class I case with mandibular anterior crowding demonstrated here (Fig. 8), the GATWD indicated a significant tooth-width excess in the mandibular anterior segment--about the width of a lower incisor.
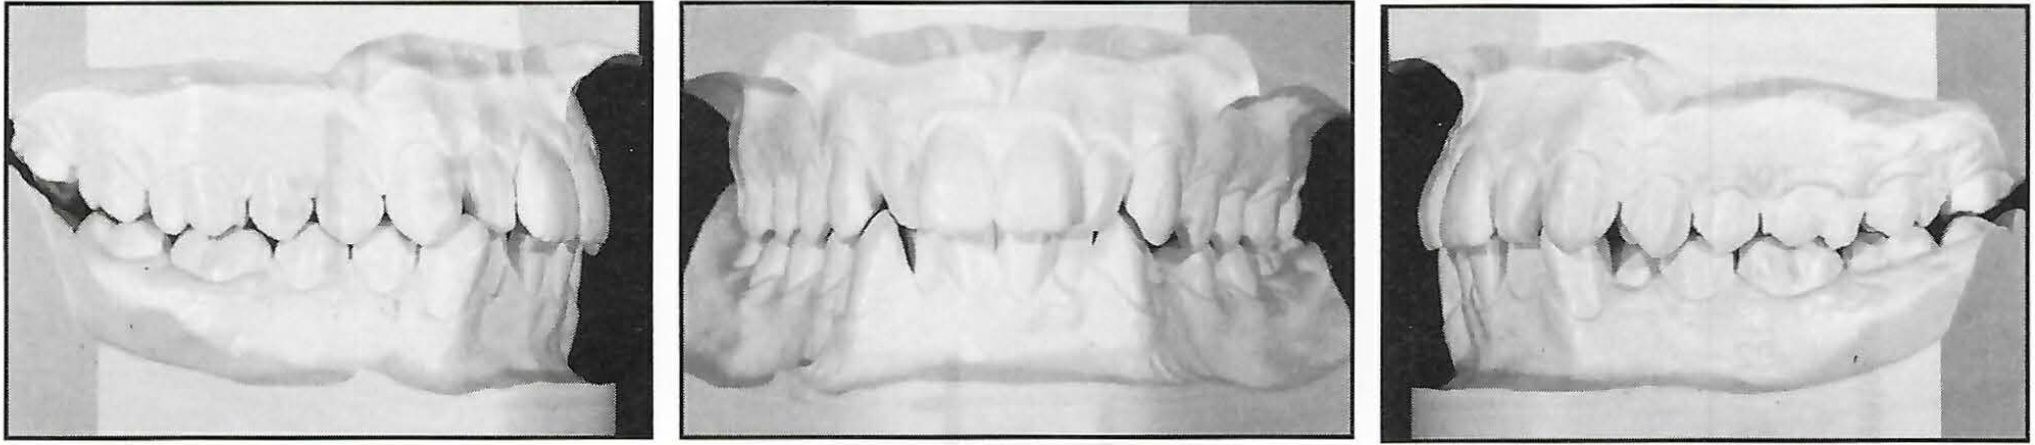
Fig. 8 Class I malocclusion with mandibular anterior crowding.
Therefore, the mandibular left central incisor was extracted. The post-treatment results show a harmonious relationship with the 14 maxillary teeth occluding on the 13 mandibular teeth (Fig. 9).
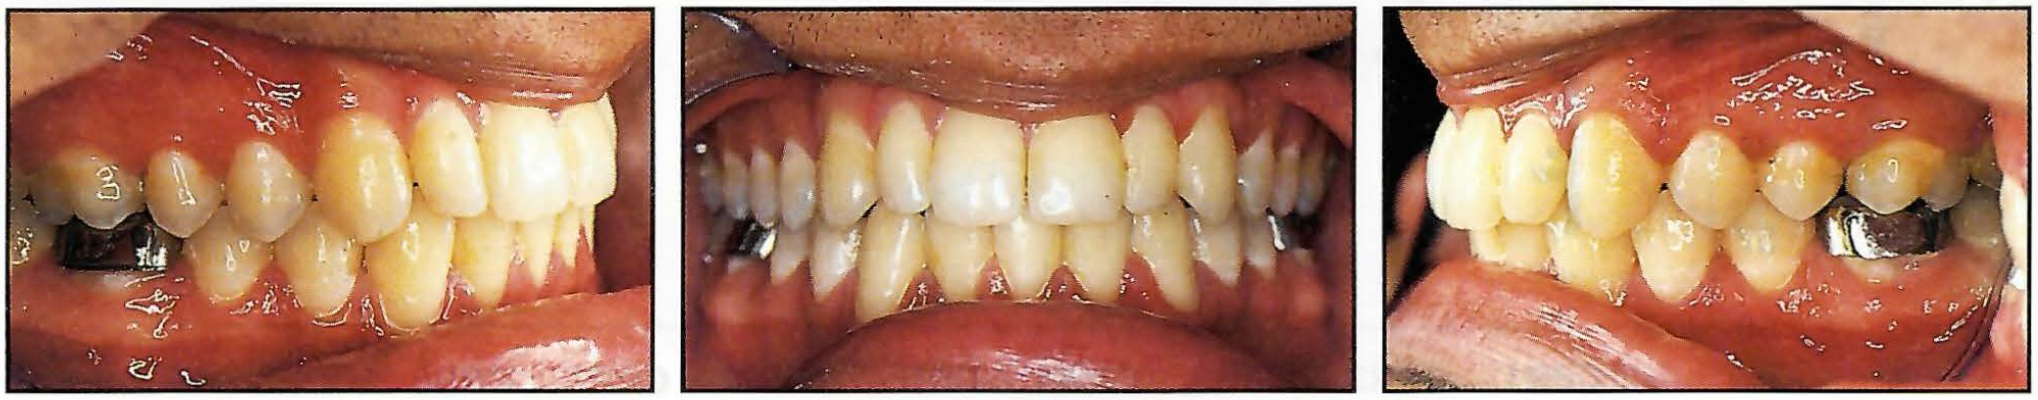
Fig. 9 Post-treatment results following extraction of one mandibular incisor.
In a different case with a near-ideal Class I occlusion (Fig. 10), the GATWD showed all tooth-width ratios falling within two standard deviations of the mean, indicating harmony between the maxillary and mandibular tooth widths (Fig. 11).
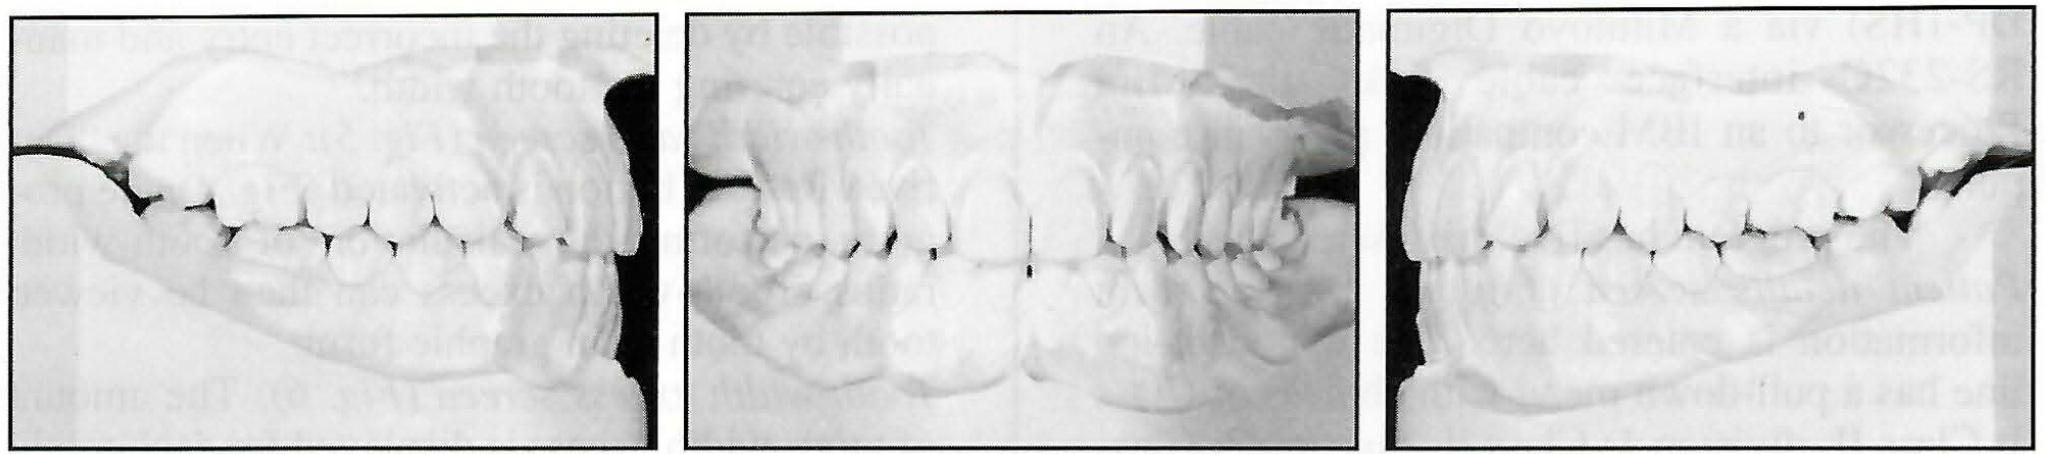
Fig. 10 Near-ideal Class I occlusion.
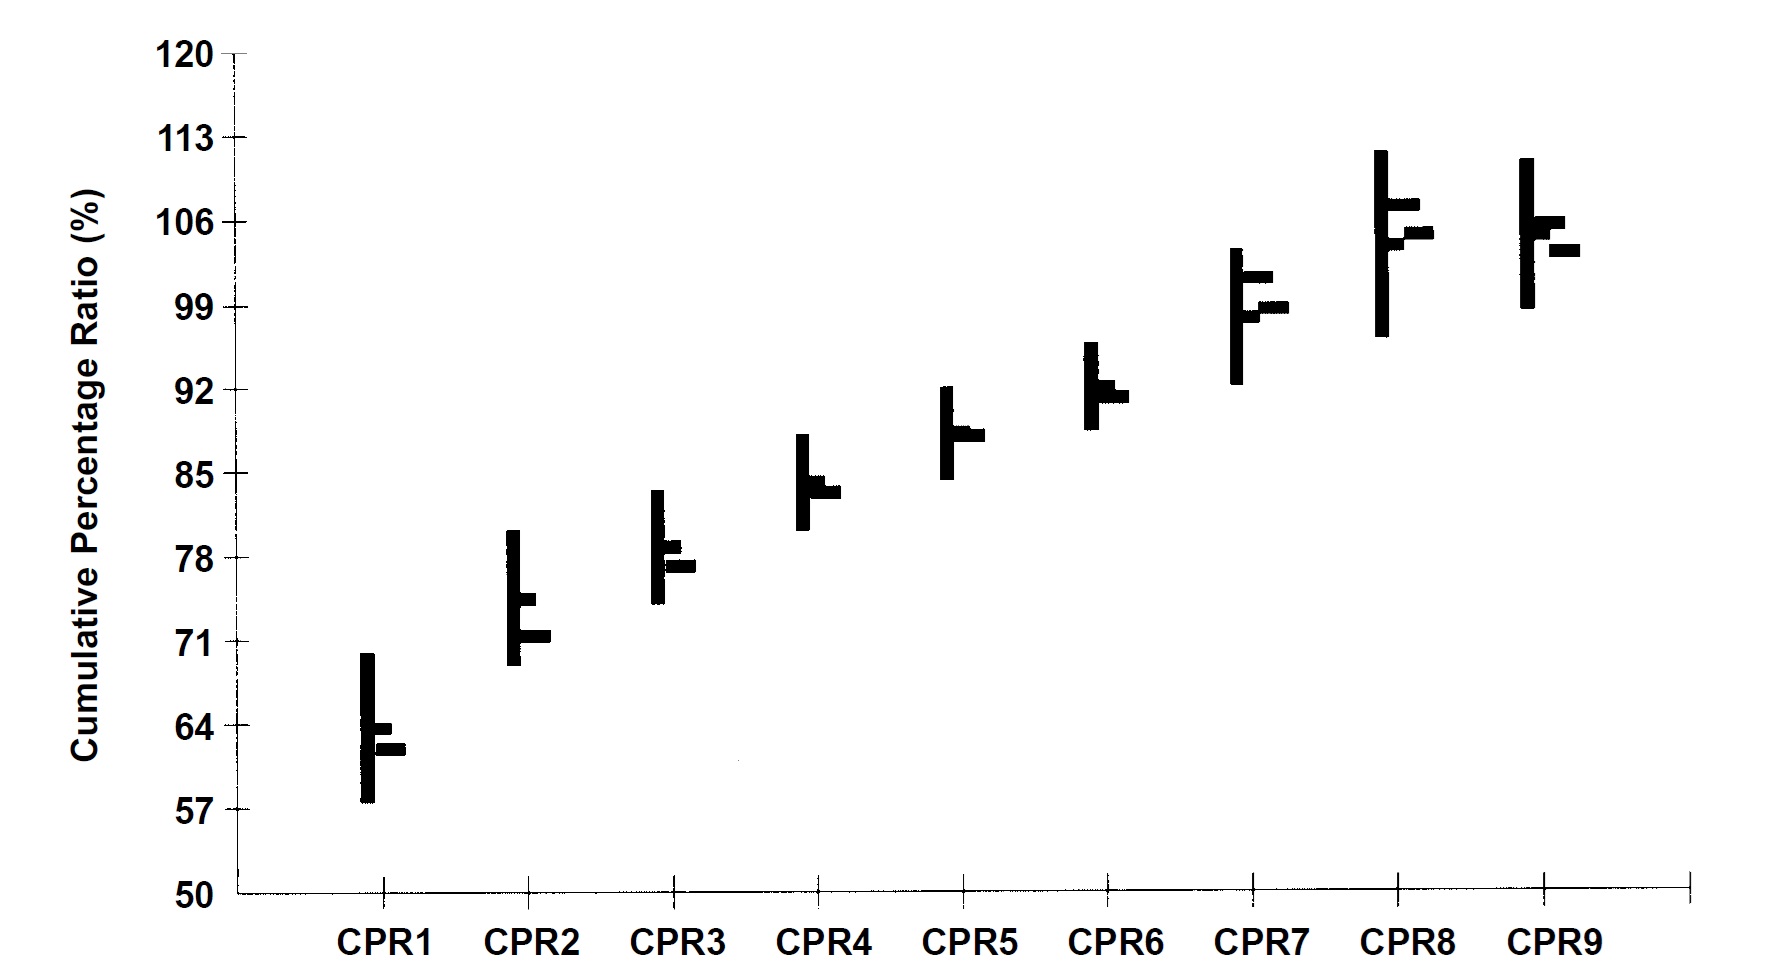
Fig. 11 Graphic display of normal occlusion compared to standard template.
Discussion
Orthodontic diagnosis should always include an analysis of the relative sizes of maxillary and mandibular teeth, especially in the anterior region, where relative tooth sizes control the amount of overbite, overjet, crowding, and spacing. Tooth-width excesses of greater than 2mm should be taken into account during treatment planning. Maxillary-to-mandibular discrepancies can have a pronounced effect on the occlusion that may not become apparent until the finishing stages of treatment.
Previous tooth-width analyses have required mathematical calculations and reference to standard tables or formulas to determine the locations and amounts of tooth-width discrepancies.1-4 Now that the more comprehensive GATWD5,6 has been incorporated into a computer software program, these inconveniences can be avoided.
The use of digital calipers with direct input into the computer program can virtually eliminate measurement transfer and calculation errors, compared to analyses that require dividers, rulers, and calculators. Although some measurement error may be associated with the positioning of the calipers on the mesial and distal surfaces of the teeth, this method is certainly more reliable than manual measurements. It provides a diagnostic tool that is convenient, consistent, and easy to operate.
ACKNOWLEDGMENT: This research was supported by the Australian Dental Research Foundation.
FOOTNOTES
- *Available from the University of Queensland School of Dentistry, 200 Turbot St., Brisbane, Queensland, Australia 4000.
- **Microsoft Corporation, Redmond, WA.
- ***Mitutoyo Corporation, Tokyo, Japan.
REFERENCES
- 1. 1. Bolton, W.A.: Disharmony in tooth size and its relation to the analysis and treatment of malocclusion, Angle Orthod. 28:113-130, 1958.
- 2. Bolton, W.A.: The clinical application of a tooth size analysis, Am. J. Orthod. 48:504-529, 1962.
- 3. Lundstrom, A.: Intermaxillary tooth width ratio and tooth alignment and occlusion, Acta Odontol. Scand. 12:265-292, 1954.
- 4. Neff, C.W.: The size relationship between the maxillary and mandibular anterior segments of the dental arch, Angle Orthod. 27:138-147, 1957.
- 5. Ho, C.T.C. and Freer, T.J.: The graphical analysis of tooth width discrepancy, Austral. Orthod. J. 13:64-70, 1994.
- 6. Ho, C.T.C. and Freer, T.J.: Clinical application of the graphical analysis of tooth width discrepancy, Austral. Orthod. J. 13:137-143, 1994.
-
 DR. HO
 -
 DR. FREER
Dr. Ho is a Lecturer in Orthodontics and Dr. Freer is a Professor of Orthodontics, School of Dentistry, University of Queensland, 200 Turbot St., Brisbane, Queensland, Australia 4000. Dr. Ho is also an orthodontist with the Children's Oral Health Service, Royal Children's Hospital, Brisbane, Australia.