The Clinical Use of Occlusograms
The value of plaster models in permitting three-dimensional studies of malocclusions for diagnosis and treatment planning and as a reference throughout treatment has obscured the value of other methods of viewing malocclusions, such as by two-dimensional occlusograms.
Occlusogram Methods
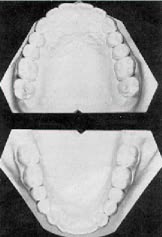
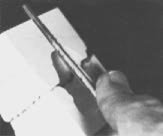
An occlusogram is a 1:1 reproduction of the occlusal surfaces of plaster models on a sheet of acetate tracing paper. A central groove cut into the backs of both models can be used to orient upper tracing to lower tracing (Fig. 1). This central orientation groove can be cut into the backs of both casts by a custom-made dental cast scriber; or a triangular file found in any hardware store can achieve a reasonable result. One simply scribes a centered perpendicular line on the backs of both casts, using a small T square. The file can then be used to cut grooves of equal depth in the casts simultaneously (Fig. 2).
When "occluding" occlusograms, one should turn the upper tracing over so that the slick side of the tracing paper faces up. This will insure that right and left sides of the upper and lower tracings coincide.
Useful and accurate occlusograms can be made in a variety of ways. Dr. Charles Burstone of the University of Connecticut developed an occlusogram camera assembly that uses a 4" X 5" box camera (a 35mm camera with a 1:1 lens does not have the film size necessary for 1:1 reproduction of dental casts), a dental cast stage, two flood lights, and a hinged Plexiglas plate (Fig. 3). A 210mm lens is used to produce a 1:1 magnification, and a Polaroid film adaptor permits instant film development. Dr. Burstone's technique is a sophisticated method of producing 1:1 occlusal reproductions of dental casts, but it has the disadvantage of requiring expensive and scarce equipment.
The Orthoscan camera (no longer available) was designed for 1:1 intraoral occlusal Polaroid photographs, but it can also produce accurate 1:1 photographs of dental casts. Unfortunately, the depth of field of this camera is almost nil, and the central orientation groove on the backs of the models is apt to be distorted and inaccurate.
Another technique is the use of a copying machine to copy the occlusal surfaces of the dental casts. The images are quite clear, but they are enlarged by as much as 10% depending on the machine used, so clinical accuracy may be seriously undermined with this technique.
The most primitive technique for making accurate 1:1 occlusal reproductions is to trace the occlusal surfaces of the teeth onto a clear 1/8" plastic sheet that is secured against the dental cast. Since the eye of the viewer is the camera, the viewer's head must not be moved while tracing both sides of the model. With a minimum of practice, highly accurate tracings can be made with inexpensive materials (Fig. 4).
Within the next few years, all of these techniques of producing occlusograms will probably become passe, as computers and digitizers become more common in orthodontic offices. Computer technology and knowledge for these tasks are available now. Dr. Burstone has published a method for producing and using computerized occlusograms (JCO, August 1979).
Occlusogram Norms
Although occlusograms have been used by a few orthodontists for several years, there have been no published norms or guidelines. Marcotte published an excellent paper regarding the clinical significance of occlusograms in 1976.1 In 1978, White published an article that illustrated how occlusograms could be used for arch form determination and arch length discrepancy measurements.2 However, neither of these investigations tried to establish any guidelines for using occlusograms.
A goal of this study is to describe normal Class I occlusion as seen via occlusograms and to establish some norms and guidelines for those who want to use occlusograms.
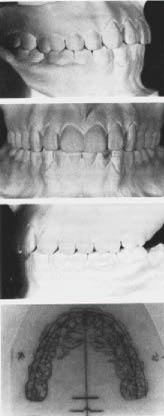
Occlusograms of twenty-four untreated normal adult Class I occlusions were made at the University of Connecticut using Dr. Burstone's photographic technique (Fig. 5). Since the measurements were made by independent, unbiased investigators using a sophisticated technique, the results (Table I) should be valid.
The measurements on this sample of occlusograms leads to some suggested guidelines:
1. Each upper tooth touches two lower teeth below it, with the exception of the last upper molar, which has only the last lower molar to bite against.
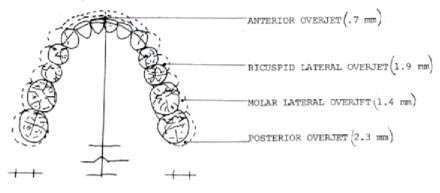
2. The biting edge of the upper anterior teeth lies in front of the biting edge of the lower anterior teeth by an average of .7mm (anterior overjet).
3. The upper posterior teeth extend beyond the lower posterior teeth by an average of 2.3mm on each side (posterior overjet).
4. The upper bicuspids are wider than the lower bicuspids by an average of 1.9mm on each side (bicuspid lateral overjet).
5. The upper molars are wider than the lower molars by an average of 1.4mm on each side (lateral molar overjet).
6. A key to firm static occlusion is the width and position of the maxillary lateral incisors. If these teeth are positioned correctly, they will extend at least to the middle of the mandibular cuspid. This will insure that the maxillary cuspid will be in proper occlusal position, contacting the lower first bicuspid. If the maxillary incisors are not wide enough to permit the lateral incisors to engage the mandibular cuspids properly, it will be impossible to achieve a firm Class I occlusion without spacing between the upper anterior teeth.
Bolton Revisited
One of the serendipitous findings of this study was related to the Bolton Ratios. Dr. Wayne Bolton published an article regarding disharmony in tooth size,3 which became the standard for comparing maxillary tooth widths to mandibular tooth widths and has remained the unchallenged authority in tooth size analysis.
Bolton made measurements of fifty-five cases with excellent occlusions. However only eleven of the cases were untreated normals. The remaining forty-four cases had been treated orthodontically on a nonextraction basis. No mention was made about the mode of treatment, or if any interproximal stripping was done on the treated cases.
Bolton was attempting to discover if there was a predictable correlation between the mesiodistal widths of all of the maxillary teeth and all of the mandibular teeth, and he concluded that there was. The ratio between the two was expressed as a percentage. This "overall ratio" was derived from the following formula:
Sum Mandibular "12" divided by Sum Maxillary "12" times 100 = Overall Ratio
The same method was used in setting up a ratio between the maxillary and mandibular anterior teeth. This was referred to as the "anterior ratio" and was formulated as follows:
Sum Mandibular "6" divided by Sum Maxillary "6" times 100 = Anterior Ratio
It is instructive to compare the data collected by Bolton and the data from our sample (Table II). The standard deviation is a constant which measures the dispersion of the data around the mean. Means become less useful and reliable as the standard deviation increases. The standard error of the mean is used to predict the degree of variation that might be expected if the experiment were repeated on other similar samples. The coefficient of variation is the standard deviation as a percentage of the mean. It is used to show the relative dispersion of two samples with different arithmetic means. The significance of the coefficient of variation is inversely related to its size. As the percentage goes down, the statistical significance increases. The means of Bolton's data and ours were quite close, but the other statistics varied greatly.
One other statistic that Bolton mentioned briefly in his article3 was the coefficient of correlation between the "overall ratio" and the "anterior ratio', which was used to measure the interdependence between the two ratios. The significance of this measurement increases as it approaches 1, which is perfect correlation. From his data, Bolton calculated a coefficient of correlation of .5. He admitted that this was not a particularly high correlation, but concluded that it was significant enough to encourage him to develop his chart of tooth size analysis which is so widely used today. However, our data resulted in a coefficient of correlation of only .12, which indicates that there is little, if any, correlation between the "overall ratio" and the "anterior ratio" Therefore, this study does not support Dr. Bolton's concept.
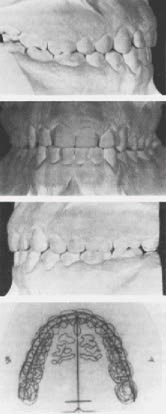
The clinical importance of this contradiction of Bolton can be illustrated with two cases from our sample (Table I). Patient #19 had a mandibular cuspid-to-cuspid mesiodistal measurement of 32mm. The Bolton Analysis Chart indicates that the maxillary anterior teeth should measure 41.5mm. However, they measure 45.3mm, which suggests that they are too wide by 3.8mm. But, when one looks at the models and occlusograms of this patient (Fig. 6), it is obvious that no such discrepancy exists--that this is an ideal arrangement of teeth.
Patient #14 had a mandibular cuspid-to-cuspid measurement of 34.7mm which, according to the Bolton Chart, should fit with a maxillary cuspid-to-cuspid measurement of 45mm. The actual measurement is 42.6mm, which suggests that the mandibular anterior teeth need to be reduced interproximally by 2.4mm. But, when one looks at the models and occlusograms (Fig. 7), it is obvious that no such alteration of tooth size is needed.
On the basis of our data, we have concluded that there is a diversity of compatible interarch tooth sizes, that Standard Bolton Measurements can be misleading, and that clinicians would be wise to withhold judgment regarding tooth size discrepancies until they can arrange simulated ideal occlusion for each patient with an occlusogram.
Clinical Significance of Occlusograms
Occlusograms have proven to be valuable clinically in four significant ways.
Individualized Arch Forms
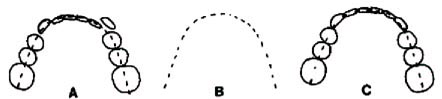
I originally used occlusograms to develop an ideal, natural, individualized arch form for each patient. It had been determined that teeth are arranged in an arc by various forces in the mouth. This natural arc can be found by drawing a dotted line through the mesiodistal dimension of each tooth and connecting these lines across the proximal contacts. The occlusal shape of each tooth can then be traced in an ideal position on this basic arch, and a customized ideal lower arch form can be constructed and used throughout treatment (Fig. 8).
Arch Length Discrepancy Measurement
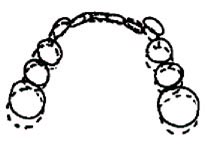
The occlusogram also permits the clinician to make highly accurate and reliable arch length discrepancy measurements by superimposing the idealized lower arch form on the original (Fig. 9).
Occlusal Simulations
Marcotte and Burstone suggested setting the maxillary teeth around an idealized lower arch form so that it would be possible to do an occlusal simulation, or what is euphemistically known as a "set-up": without the time and inaccuracies inherent in a plaster model technique. Occlusal simulations permit the orthodontist to quickly see if the maxillary teeth even have the possibility of occluding with the lower correctly.
In the past we have relied upon the tooth size analysis for determining interarch tooth size discrepancies, but the clinical use of occlusograms has made it clear how questionable the accuracy of the Bolton Ratios is. This study has revealed how varied the percentages of upper to lower tooth masses can be and still be normal. The most accurate way of doing a tooth size discrepancy measurement is to perform an ideal occlusal simulation via occlusograms, to see if the teeth will fit together without mesiodistal alteration. This is why norms for occlusograms need to be established. Anyone completing a course in dental anatomy has a fair idea of how teeth should fit together, but there has not been any study available to show how ideal occlusions fit together when seen via occlusograms.
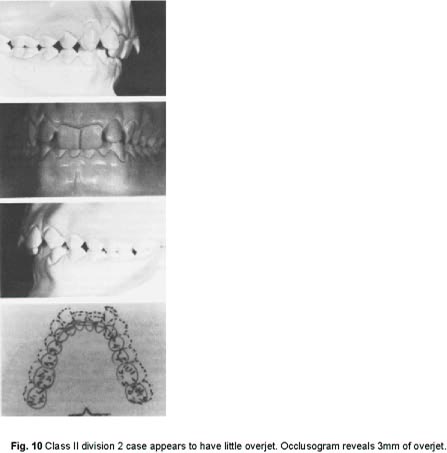
Tuverson4 and Andrews5 have wisely suggested that improper torque and/or tip on the anterior teeth will limit available arch length, and that is certainly true. When upper anterior teeth, in particular are not tipped and torqued correctly, space for proper occlusion is lost. Proper overjet is equally important. For instance, when one looks at the following Class II division 2 case, it seems that there is no clinical anterior overjet (Fig. 10). Not many clinicians would attribute more than lmm of anterior overjet to this case. Yet when we look at this patient via occlusograms, we measure 3mm of anterior overjet. This is the true anterior overjet and it greatly influences the tip and torque of the anterior teeth; because, as these improperly inclined teeth continue to erupt, the maxillary and mandibular incisors telescope over one another so that a wider part of the maxillary incisor is engaged by the incisal edge of the mandibular incisor. This telescoping, simultaneously, inclines the mandibular incisor lingually so that its occlusion is now lingual to the maxillary central's cingulum, which is that tooth's widest part.
When teeth have proper tip and torque, they have the highest possibility for proper overjet, which in our sample ranged from 2.3mm to 0 and averaged .7mm. It is a rare patient who can show 4-5mm of overjet and also demonstrate acceptable tip and torque of the anterior teeth. They go hand in hand, so that when ideal occlusograms are designed with 1mm of anterior overjet, one is assuming correct tip and torque for the incisors too.
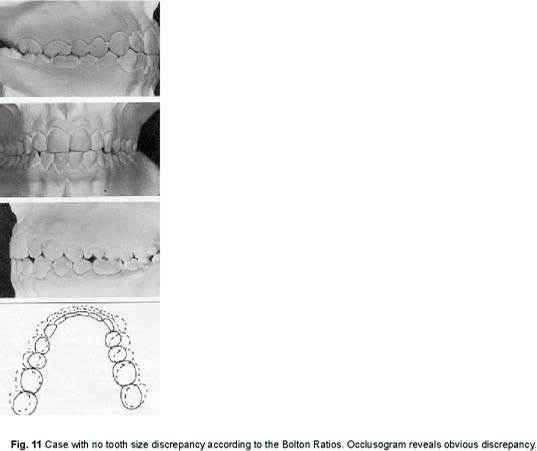
Tooth size discrepancies are far more common than we have been led to believe by traditional Bolton Ratios. The patient seen in Figure 11 is typical of patients in whom no Bolton Discrepancy is found when classical Bolton Ratios are used. But when diagnostic occlusograms are used, obvious interarch tooth-size discrepancies are revealed. One could treat this patient flawlessly, but never achieve a firm Class I occlusion. How often does this occur in practice? Ordinarily, the orthodontist shrugs and mutters something about losing upper molar anchorage, when, in fact, there was never any possibility of arranging these teeth in a firm Class I occlusion without altering the sizes of the teeth.
Most tooth size discrepancies are like the one illustrated above, in that they involve a superabundance of lower tooth mass. This presents the orthodontist with several alternatives: 1) He can arrange the upper posterior occlusion in a Class I relationship and leave a space in the upper anterior segment. 2) He can increase the size of some upper anterior teeth (usually the lateral incisors) via jackets so that ideal tooth size can be attained. 3) He can reduce the lower tooth mass by interproximal polishing or, in some cases, eliminate a lower incisor altogether. There are times when each of these alternatives or a combination of them might be chosen; but ordinarily the interproximal reduction offers the most reasonable and least offensive approach.
Several years ago, Cavitron Corporation had a thin-blade instrument that was used with its ultrasonic prophylaxis unit for interproximal polishing. However, when the ADA, inexplicably, withdrew its approval of the instrument despite its proven safety and usefulness, Cavitron stopped making it. Orthodontists were then left with only their imagination and very few instruments that could reduce teeth interproximally, and simultaneously recontour and protect the teeth from future caries.
Unitek Corporation recently introduced an ultrasonic prophylaxis unit that lends itself quite nicely to interproximal reduction and also permits variation in the water spray so that the fluoride-aluminum oxide paste will not be quickly washed away as the enamel reduction is being done.
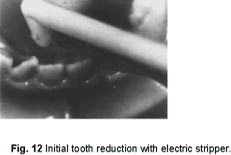
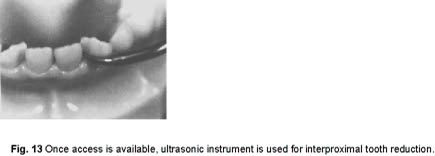
Before the ultrasonic polishing tip can be placed interproximally, it is necessary to gain some space by polishing with either a manual or electric interproximal, diamond-encrusted stripper (Fig. 12). The effectiveness of these interproximal strippers can be greatly increased with the simultaneous use of the fluoride-aluminum oxide paste. This paste will also extend the useful life of these polishing tips. If the anterior teeth are tightly aligned, it is sometimes necessary to use a mechanical separator to gain access. Once access is available, the ultrasonic instrument can be used quite effectively (Fig. 13).
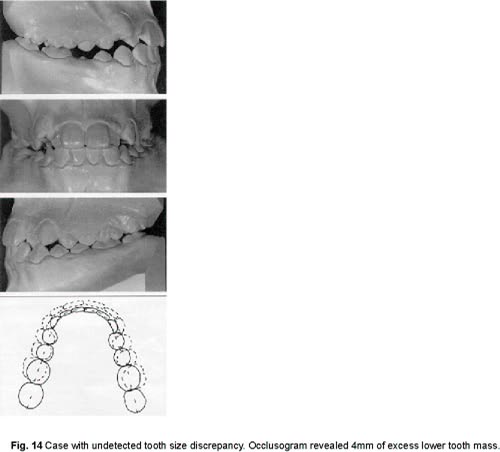
Figure 14 illustrates a patient who had an undetected, serious tooth size discrepancy. Treatment was started and the patient was quite cooperative. The posterior teeth were moved into a Class III arrangement, but there was still not enough space to move the maxillary cuspids distally into a firm Class I. Occlusograms reveal the problem area--too much lower tooth mass by approximately 4mm. Interproximal polishing gained enough space for the lower teeth to be consolidated mesially, and this allowed the seating of the cuspids into a firm and successful Class I position.
Evaluation of Various Treatment Plans
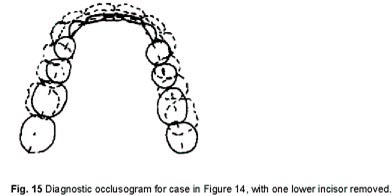
The records of the previous patient also reveal a final use for occlusograms. It is obvious from the measurements that the elimination of a lower central incisor might have been as reasonable an approach to the reduction of lower tooth mass as interproximal polishing. This alternative is shown in the occlusogram (Fig. 15).
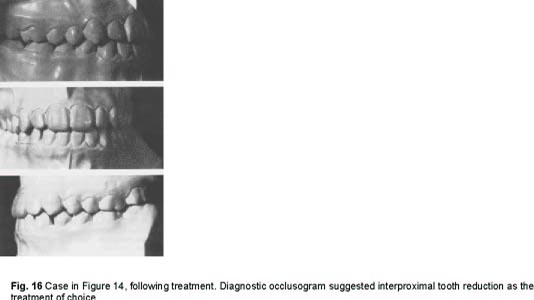
With occlusograms, the orthodontist can try any alternative he can think of without risk or harm to the patient. In the illustrated case it was felt that interproximal polishing offered the better choice because of the larger than optimal posterior overjet the removal of an incisor would produce. Once a decision is made regarding the diagnosis and treatment plan, the orthodontist can implement this plan with a high level of confidence (Fig. 16).
Occlusograms provide a diagnostic tool that permits greater accuracy in orthodontic diagnosis and treatment planning; and although their use requires additional equipment and time from the orthodontist, the rewards to both patient and doctor clearly make them worthwhile adjuncts to the ordinary orthodontic diagnostic armamentarium.